


We at Crest Data are introducing high-performance plugins for a diverse array of IT and security platforms, including Akamai, Dell PowerScale, Fortinet, Meraki, NetApp ONTAP, Proofpoint, Tableau, Zoom, and Zscaler (ZIA, ZPA). This launch brings additional enterprise-grade visibility directly into the Grafana ecosystem.
“There are 170 data sources we have in our catalog, but we believe there is room for more data sources, more apps, for normal telemetry, but it goes a bit beyond: hardware, industrial, IoT.”says David Kalschmidt, VP of Engineering at Grafana Labs, during the GrafanaCON 2026 keynote, where he outlined how the Grafana Marketplace will support the continued, sustainable growth of these plugins.“We’ve started with a select group of partners now, and they have already built the first few apps, and they are already in the catalog”
“We are pleased to be a launch partner for the new Grafana Marketplace. By providing 10 plugins at launch, we are empowering the Grafana community to unlock the full potential of their IT and security stacks,” said Malhar Shah, CEO at Crest Data.“We look forward to a continued partnership and to supporting the growth of this evolving ecosystem.”
Crest Data plugins are designed to eliminate data silos. By providing a single pane of glass within Grafana, IT operations teams can now monitor storage health, CDN/network performance, and business KPIs alongside security teams who require instantaneous visibility into threats and critical audits.
By using the query-in-place functionality of the Grafana plugin framework, we are able to save costs and accelerate security approvals. The Crest Data team proactively maintains each plugin to ensure continuous compatibility with the latest versions of hardware and software stacks.
Spotlight: Maximizing Storage Health with the NetApp ONTAP Grafana plugin
To demonstrate the power of these plugins, let’s look at the Crest Data NetApp ONTAP plugin.
Storage is the backbone of the enterprise, and NetApp ONTAP is at the heart of many mission-critical infrastructures. But when storage hits a bottleneck, it ripples through every application in the stack.
The Crest Data NetApp ONTAP Plugin gives storage administrators and DevOps teams a high-fidelity view of their storage environment without needing to leave Grafana. By pulling metrics directly from ONTAP clusters, you can:
- Optimize Performance: Monitor IOPS, throughput, and latency across clusters, nodes, and volumes to identify exactly where congestion is occurring.
- Prevent Capacity Crises: Track aggregate and volume utilization with historical trends to forecast when you’ll actually need more storage, moving away from “just-in-case” over-provisioning.
- Unified Visibility: Whether your ONTAP is on-premises or running in the cloud, you get a consistent monitoring experience across your entire data estate.
Getting Started
Getting started is seamless: simply navigate to the Grafana Marketplace and search for the NetApp ONTAP Crest Data plugin. Once installed, enter in your NetApp ONTAP Cluster URL and credentials to start using the plugin.
No complex middleware or heavy ETL processes are required; you can go from installation to live visualization in under five minutes.
Actionable Dashboards
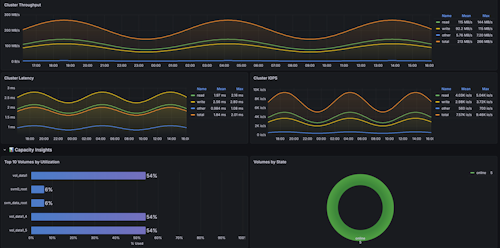
Cluster Performance: This dashboard provides a real-time, high-level overview of your NetApp cluster’s performance and health to verify system uptime, monitor latency against throughput spikes, and track volume utilization to ensure seamless data delivery.
Spotlight: Monitoring Security Traffic with Grafana
Now, let’s look at the Crest Data FortiGate Plugin.
As a global leader in network security, Fortinet’s FortiGate delivers enterprise-grade firewall and threat protection, safeguarding networks across organizations of all sizes.
With the Crest Data FortiGate plugin, teams can strengthen their security posture by monitoring firewall traffic to detect, analyze, and respond to intrusion attempts, policy violations, and suspicious network activity.
Getting Started
Just like the NetApp plugin, getting started is seamless: navigate to the Grafana Marketplace and search for the FortiGate Crest Data plugin. Once installed, enter your FortiGate URL and API token to configure your plugin and start monitoring your firewall traffic right away.
Actionable Dashboards
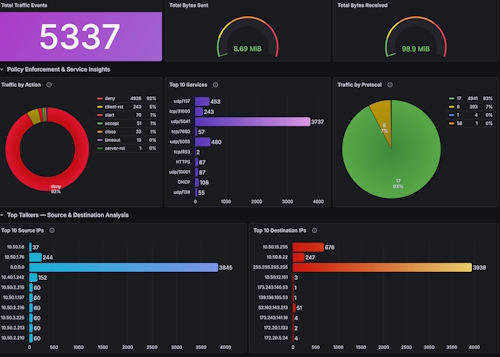
Network Overview: This dashboard provides comprehensive observability into FortiGate traffic by correlating high-level security events with granular source, destination, and bandwidth analytics. It enables administrators to instantly audit policy enforcement, identify top-talker anomalies, and drill down into raw traffic logs for rapid troubleshooting and threat hunting.
Conclusion: Optimize your IT and Security Stacks
By bridging the gap between IT and security tools, Crest Data plugins do more than just display metrics; they give your team the breathing room to proactively optimize your IT and security stacks. We’re excited to see what you build with this level of clarity. Check us out on the Grafana Marketplace to get started.
Thought Leader: Rishi Divate