

From there, the work typically moves through requirements gathering, use-case creation, dashboard design, data source connection and query creation, dashboard and panel creation, and publication – a sequence of tasks that can stretch across several days.
Now imagine that same request expressed in plain English:
Build a four-panel SOC dashboard showing daily alert volume, open incidents by severity, mean time to triage, and the top alert-generating detection rules.
Instead of generating tasks and waiting for multiple days, the request is interpreted end-to-end. In minutes (rather than days), a fully composed dashboard is created, connected to your data lake, and populated with validated queries and visualizations.
With this, the bottleneck is no longer building the dashboard – it’s deciding what to build. Work that once spanned several days, from analysis to a finished dashboard, compresses into a single automated run.
Closing the gap between a business request and a production-ready dashboard has long been hard. Individual tasks such as query generation or chart creation can be automated in isolation, but delivering a consolidated dashboard still requires context, reasoning, validation, and coordination across multiple systems. This is precisely the problem that modern AI agents are beginning to address: rather than automating isolated tasks, they can orchestrate the entire workflow – from understanding intent to publishing the dashboard while maintaining the controls expected in enterprise analytics environments.
Understanding the Dashboard Creation Process and How AI Can Help
Turning a business question into a single dashboard requires the following decisions to be made correctly:
- Interpreting intent: translating a vague request into concrete metrics, dimensions, and visualization types.
- Understanding the data landscape: identifying the correct data lake tables/indexes to search, how they join, which fields are numeric versus textual, and how to handle semi-structured data stored in JSON columns.
- Writing analytically correct SQL: not just syntactically valid, but producing meaningful results once aggregations, joins, grouping, and null handling are accounted for.
- Authoring and publishing: building panels or worksheets, assembling dashboard panels, configuring data connections, and publishing to dashboard server or platform with the right governance controls.
Each step introduces process bottlenecks and failure points. Multiply this across the panels of a single dashboard, and the operational cost becomes obvious.
AI has the potential to reduce much of this manual effort by automating the reasoning and execution required at each stage. Instead of treating dashboard creation as a collection of disconnected tasks, AI systems can help bridge the gap between business intent, data understanding, query generation, and dashboard authoring.
The key observation is that this is not a single AI task. It is a sequence of specialized decisions, where each step depends on the validated output of the one before it. That dependency structure is exactly what makes dashboard generation a good fit for a coordinated multi-agent system rather than one large, monolithic prompt.
LangGraph to orchestrate the system as a graph of specialized agents and decision nodes. Each node is responsible for a well-defined task and passes validated outputs to downstream stages, creating a transparent and controllable execution flow. For observability and operational telemetry, we used LangSmith, which provided end-to-end tracing, execution monitoring, and debugging capabilities across the entire agent workflow. This architecture allows complex dashboard-generation tasks to be decomposed into smaller, specialized units while maintaining visibility into how decisions are made and how outputs are produced at each stage of the pipeline.
Why Agents Instead of One Large Prompt?
Asking a single model to understand intent, design a dashboard, write SQL, validate results, and publish – all at once produces a system that is hard to inspect and harder to fix when it goes wrong. In practice, this end-to-end approach is also constrained by context limits, the need for specialized domain knowledge at different stages, and the growing complexity of real-world data environments. Splitting the work into specialized agents, each producing a structured output that feeds the next stage, has several concrete advantages: failures become easy to localize, panel generation can run in parallel, and validation can be targeted at each step.
Our implementation is built around a few characteristics common to robust agentic systems:
- Planning. A dedicated Query Planner agent decides tables, joins, aggregations, and null-handling strategies before any SQL is generated.
- Grounded context. Before query generation begins, the system introspects the data lake schema – including the actual keys present inside JSON columns and combines that with domain-specific product knowledge, so decisions rest on real data structures rather than assumptions.
- Specialization. Each agent has one clearly defined responsibility and emits a structured, machine-validated output, which makes the pipeline reliable and easy to troubleshoot.
- Tool usage. Agents interact directly with enterprise systems: they query data lakes for schema discovery and execution, and they publish completed dashboards to their corresponding UI.
- Self-correction. When a step fails, the system doesn’t blindly repeat it – it analyzes the failure, folds it into context, and generates a revised strategy.
The Architecture: A Two-Stage Agentic Pipeline
At a high level, this enterprise-ready AI agent architecture is two distinct stages connected by a clean handoff.
- Stage 1 turns user prompts into validated data by decomposing the request into individual dashboard panels, generating the SQL required for each panel, and executing those queries to retrieve complete, non-corrupted, and analytically meaningful results. The output of this stage is trusted panel-level data that is ready for visualization.
- Stage 2 turns that data into a published dashboard by creating the code required for each panel and consolidating panels. Separating them means each stage can be tested, improved, and governed independently, and downstream components only ever operate on verified inputs.
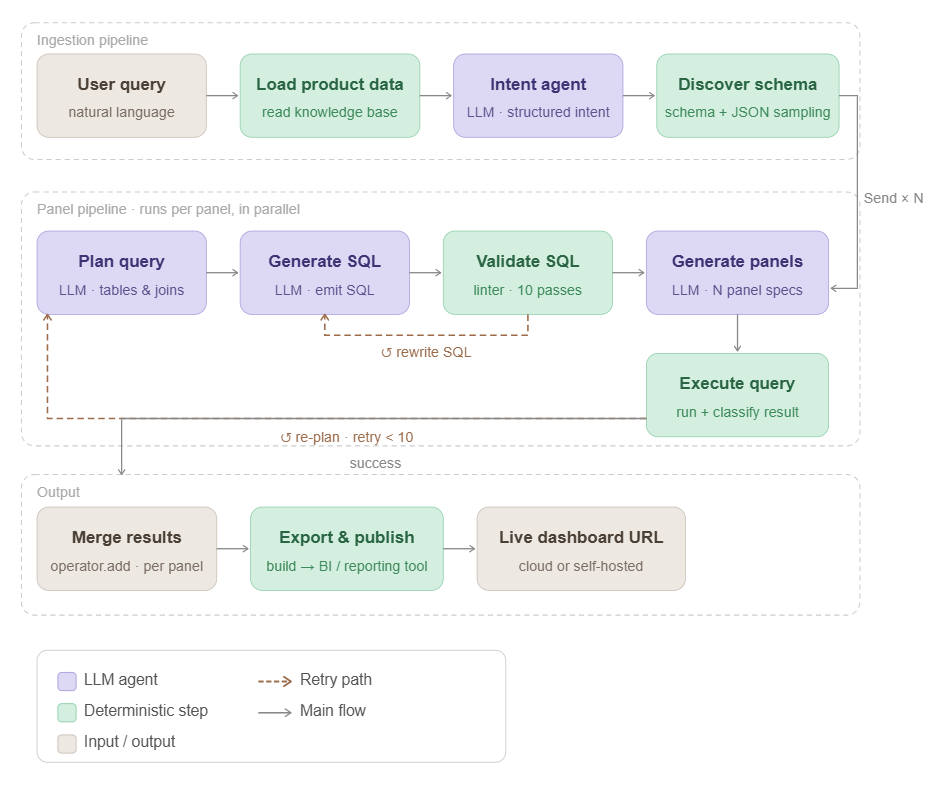
Under the hood, Stage 1 is implemented as a LangGraph state graph. Each agent uses structured (schema-constrained) outputs, so the contract between stages is explicit and machine-validated rather than free text.
Stage 1: From Intent to Validated SQL for Each Proposed Panel
Stage 1 is responsible for transforming a user’s natural-language dashboard request into a set of validated analytical panels that can be safely visualized. Rather than treating the dashboard as a single task, the system decomposes it into independent panel-level workflows that can execute in parallel.
- Intent Extraction: Interprets the user’s request and translates it into concrete business metrics, dimensions, filters, and dashboard requirements. The dashboard is then decomposed into individual panels, each representing a distinct analytical objective with its own data requirements.
- Schema Discovery: Introspects the live data warehouse schema and discovers the actual structure of the underlying data. For semi-structured datasets, the agent samples real rows and identifies the top-level keys present inside JSON columns, ensuring downstream agents work with observed schema information rather than inferred field names.
- Per-Panel Pipeline (Executed in Parallel): Once panel definitions are created, each panel is processed independently in an isolated execution context:
- SQL Planning: Defines the analytical approach and query structure, including required tables, joins, aggregations, filters, calculations, and grouping logic.
- SQL Generation: Produces executable SQL based on the planned analytical strategy and discovered schema.
- SQL Validation: Uses SQLGlot to perform static validation, then executes the query against the warehouse to verify correctness and confirm that valid data is returned.
Because each panel is processed independently, retries or failures are isolated to a single panel and do not impact the rest of the dashboard generation workflow. The output of Stage 1 is a collection of validated dashboard panels, each backed by SQL that has been both syntactically validated and successfully executed against the data warehouse.
Stage 2: From Data to a Published Tableau Dashboard
The second stage consumes Stage 1’s verified outputs and transforms them into a complete analytics experience. Individual visualizations are generated, assembled into dashboards, and configured with the appropriate data connections, layouts, and metadata; the resulting artifact is then published to the organization’s analytics platform through its supported APIs and deployment mechanisms.
Crucially, the dashboard remains connected to the underlying data sources rather than relying on static snapshots wherever possible. This allows visualizations to refresh against current data, ensuring that users interact with up-to-date information while maintaining the governance, access controls, and operational standards of the target platform.
The Self-Healing Loop: Designing for Failure
One of the most valuable properties of the system is that it assumes initial attempts may fail and is designed to recover automatically. Generating SQL against an unfamiliar schema is inherently difficult. Even syntactically correct queries can return empty results, use the wrong dimension, or rest on incorrect assumptions about the data. Rather than treating a failure as terminal, the system uses a two-level retry strategy that routes the failure back to the right agent depending on what kind of failure it is: