
Teams that are just getting started with Datadog, need to take the time to understand how Datadog works, how it differs from platforms they have used before, and how to establish standards across the organization, without spending months figuring it out. Our goal with both these Quick Start Services is to collapse that timeline to weeks and set you up for long-term success.
Our Full-Stack Observability Quick Start is a three-week professional service targeting the three core observability pillars: Infrastructure Monitoring, Log Management, and APM. We deliver customized dashboards, intelligent alerting, and seamless integrations for immediate operational impact.
Our Agent Observability Quick Start is a four-week professional service that implements comprehensive observability for AI-powered applications via Datadog, surfacing insights into model performance, quality, and cost so stakeholders can make confident, data-driven decisions.
Get to Full-Stack Observability Faster
Full-stack observability refers to the ability to get complete visibility into all layers of your application stack, to determine not just when things go wrong, but why and where they went wrong.
To achieve full-stack observability, you need to ensure you are collecting telemetry data from the three key pillars: logs, metrics, and traces, across all layers of your application stack: infrastructure, hyperscaler/application services, network, and databases. All telemetry collection and data access is set up with security and compliance in mind, so your monitoring environment meets your organization’s standards from day one.
Week 1: Discovery, Planning and Infrastructure Monitoring Quick Start Activities
We begin this week by assessing your monitoring requirements, defining your Service Level Objectives (SLOs) and determining associated Service Level Indicators (SLIs) (such as CPU utilization, memory usage, and network latency). We then go deep into monitoring your infrastructure and network through agent deployment, data ingestion setup, and analytics via dashboards and monitors. The goal of this week is to ensure you can quickly and confidently determine when something is wrong with your infrastructure.
Week 2: Log Management
This week, we focus on onboarding and analyzing log data from standard sources such as web servers, databases, and hyperscaler services (AWS, GCP, Azure). As in Week 1, we create dashboards and alerts to analyze collected log data. We also apply parsing and filtering to optimize data ingestion. The purpose of this week is to determine why a problem occurred, for example, a configuration error or change.
Week 3: Application Performance Monitoring (APM), Tracing, Knowledge Transfer
In Week 3, we focus on APM and distributed tracing. The goal is to diagnose where a problem manifested, for example, in the “billing” service. We do this by instrumenting key services, configuring service maps, establishing end-to-end tracing, and creating APM performance dashboards and alerts. As this is our final week, we also conduct a hands-on workshop to walk you through everything we’ve built, along with documentation and a recommended roadmap for what to focus on going forward.
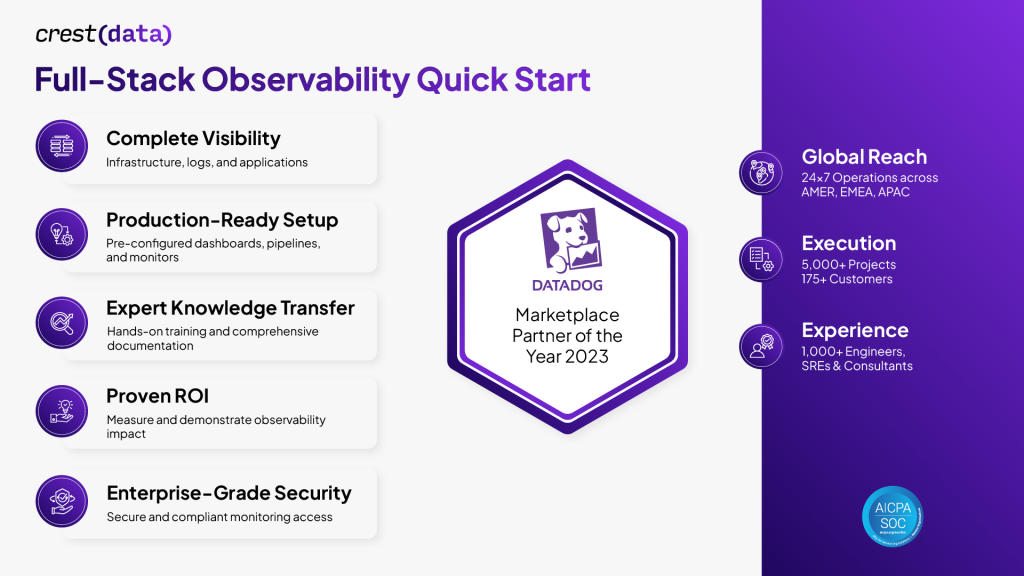
By the end of our Full-Stack Observability Quick Start Service, you’ll walk away with:
- Complete Visibility: Full coverage across infrastructure, logs, and applications
- Rapid Implementation: Pre-configured dashboards, pipelines, and monitors from day one, no heavy lifting required
- Cloud Support: Integration with AWS, GCP, and Azure
- End-to-End Tracing: Service mapping, distributed tracing, and application insights to diagnose production issues quickly
Optimize AgentCost and Performance
For organizations building AI-driven applications, Agent observability has become essential. Between a prompt and a model’s response sits a chain of token processing, retrieval steps, vector lookups, agent handoffs, and generated output. Most engineering teams have almost no granular visibility into what’s happening inside that chain and how much it costs.
Datadog’s Agent observability capabilities close that gap, by providing a correlated view of your entire AI stack, from infrastructure and retrieval, through model inference, and output quality to costs.
Crest Data’s Agent Observability Quick Start gets you to actually using this platform in production in four weeks. Our consultants bring deep expertise across AI, and Datadog implementations, handling the instrumentation, configuration, and knowledge transfer so your team is not starting from scratch. From defining your KPI framework to delivering a production-ready Agent observability setup and roadmap, we make sure you leave with both the tooling and the confidence to optimize costs and performance of your AI applications.
Week 1: Discovery, Architecture Review, and Datadog Setup
We begin by understanding your AI landscape, discovering active use cases, reviewing your architecture, and building a full inventory across the application layer, model providers, vector databases, orchestration layer, and MCP or tool integrations. We validate Datadog access, RBAC, and SSO to ensure secure and compliant monitoring from the outset, and close the week by establishing a KPI framework. These foundations are critical for building a scalable Agent observability practice as AI applications grow in complexity.
Week 2: Instrumentation and Trace Collection
With the foundation in place, we instrument your key AI workflows, capturing the full request chain from application through retrieval, model calls, tool/MCP interactions, and final response. We integrate your model providers and MCP or tool integrations, capturing rich metadata along the way. The week closes with foundational dashboards covering throughput, latency, failures, and token consumption.
This instrumentation also creates the foundation for AI observability, enabling visibility into agent interactions, tool usage, and decision paths.
Week 3: Quality, Cost, and Reliability Observability
We start this week by building dashboards covering token usage, failure modes and costs across various dimensions. We will then configure monitors to alert on latency spikes, errors, anomalies, and degraded retrieval behavior. We also define an initial quality framework and deliver a consolidated summary dashboard bringing key signals into a single view. This phase helps organizations move beyond basic monitoring and establish a more mature Agent Observability strategy.
Week 4: Operationalization, Handover, and Roadmap
Since this is our last week, we focus on equipping your team to own and evolve what we have built together. This includes an AI observability runbook for common incident scenarios, recommendations for tracking various parameters, governance guidance for safe rollout, and cost optimization recommendations. The week closes with a knowledge transfer workshop, documentation, and a recommended roadmap covering evals, guardrails, and production SRE practices.
The roadmap is designed to help teams continuously expand their agent observability capabilities as adoption increases.
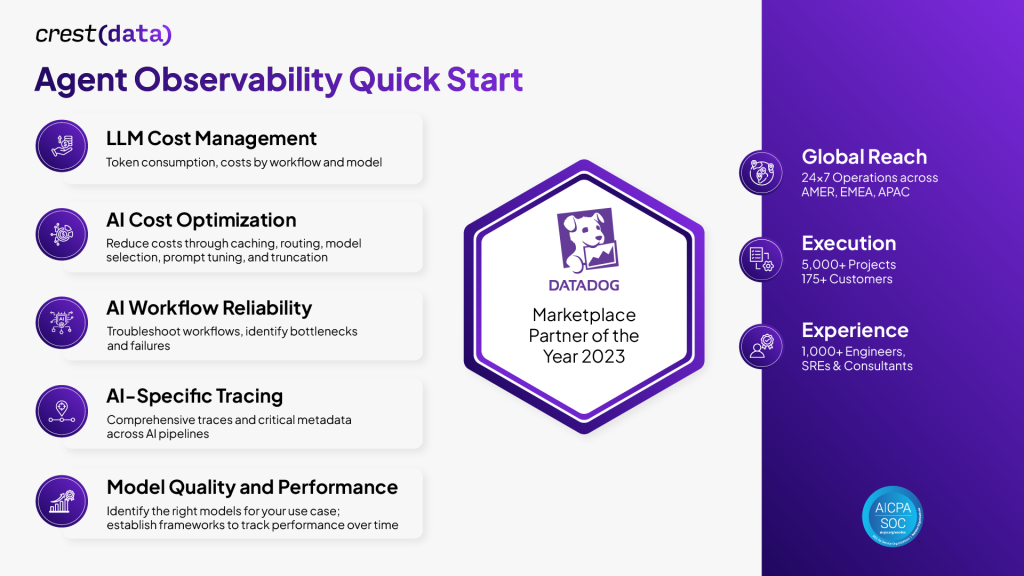
By the end of our Agent Observability Quick Start Service, you will get:
- Agent Cost Management: Gain deep insights into token consumption and track costs, allowing your stakeholders to make data-driven investment decisions
- AI Cost Optimization: Identify specific opportunities to reduce AI spending
- AI Workflow Reliability: Quickly identify bottlenecks, failures, and troubleshoot degraded AI workflows
- AI-Specific Tracing: Capture comprehensive traces across the entire AI pipeline to strengthen both LLM observability and AI observability.
- Model Quality and Performance Analysis: Compare and determine which models are best suited for your use case and establish initial frameworks to measure quality in a repeatable way
Get Started Now
To get started with either of these observability quick start offerings and accelerate your full-stack observability or Agent observability journey, contact us at datadog-sales@crestdata.ai
Thought Leader: Rishi Divate