


That gap is what a maturity model is for. It gives teams a shared vocabulary for where they are today, a structured view of what better looks like, and an honest way to prioritize the next step. It replaces “we need more observability” with a specific answer to what, why, and in what order.
This guide lays out a vendor-neutral enterprise observability maturity model built around four levels and eight assessment dimensions. Use it to establish a baseline, choose improvement priorities, and track progress over time, whether you are just standing up an observability practice or looking to move a mature one to the next level.
1. Purpose and Scope
Observability helps teams understand the internal state of a system by examining the signals it produces. A mature practice combines telemetry, clear ownership, repeatable processes, and business context. The goal is to make faster decisions and better service outcomes, not more dashboards.
| Use the model as a guide. Different services and teams may sit at different levels. Assess each area independently, then invest in where the business risk or opportunity is greatest. |
Guiding Principles
- Start with purpose. Connect improvement work to reliability, engineering effectiveness, or digital experience.
- Build a dependable foundation. Consistent instrumentation and ownership support every later capability.
- Measure outcomes. Track changes in service health, delivery performance, user experience, and operating effort.
- Improve continuously. Reassess after major architecture, product, or organizational changes.
2. Model Structure
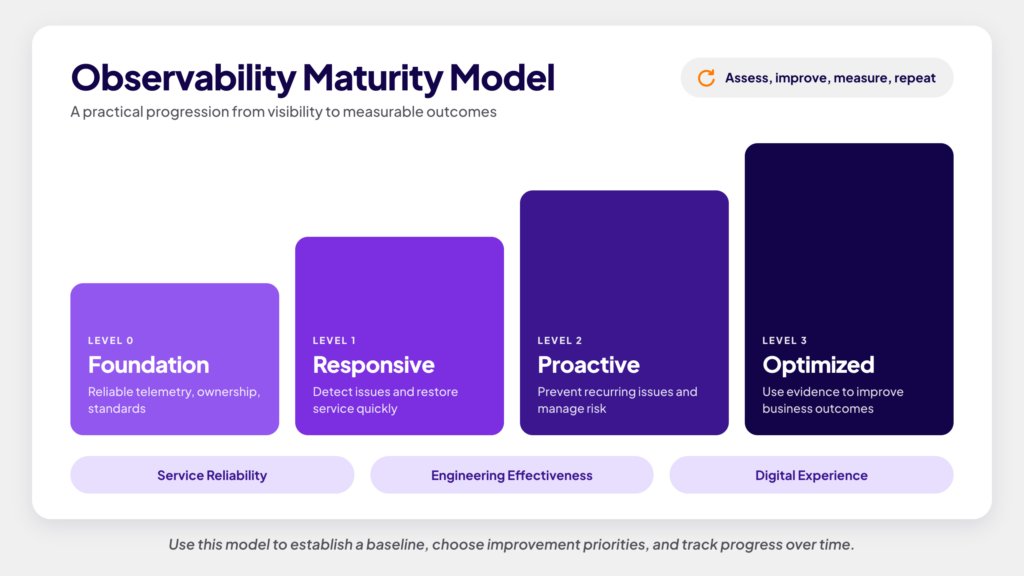
The model has one foundation level and three progressive levels. Teams can advance along one or more value paths, depending on their priorities.
| Level | Name | Primary focus | Typical result |
| 0 | Foundation | Telemetry, standards, ownership | Teams can trust and find the data they need. |
| 1 | Responsive | Detection, triage, recovery | Teams identify impact and restore service consistently. |
| 2 | Proactive | Prevention, learning, risk control | Teams reduce repeat incidents and catch risks earlier. |
| 3 | Optimized | Automation, business context, continuous improvement | Leaders connect technical performance to business outcomes. |
Value Paths
Service Reliability: Keep critical services available and recover quickly when failures occur.
Engineering Effectiveness: Improve how teams build, release, operate, and learn from software.
Digital Experience: Protect the speed, stability, and usability experienced by customers and employees.
3. Maturity Levels
Level 0: Foundation
Outcome: Create trustworthy, accessible telemetry and clear operational ownership.
Common practices
- Instrument critical services across metrics, logs, traces, events, and user signals.
- Define naming, tagging, retention, access, and data-quality standards.
- Maintain a current service catalog with owners, dependencies, and support information.
Useful measures: Coverage of critical services; Telemetry quality and consistency; Percentage of services with an identified owner.
Level 1: Responsive
Outcome: Detect meaningful issues, understand impact, and restore service through repeatable response practices.
Common practices
- Monitor service health and customer impact, not infrastructure signals alone.
- Route actionable alerts to the correct owner with a useful context.
- Use incident playbooks, timelines, and reviews to improve response.
Useful measures: Time to detect and restore; Actionable alert rate; Incident recurrence.
Level 2: Proactive
Outcome: Use operational evidence to prevent repeat failures and control service risk before customers notice.
Common practices
- Define service objectives and error budgets for critical user journeys.
- Correlate telemetry across services and dependencies.
- Apply findings from incident reviews to architecture, testing, capacity, and release controls.
Useful measures: Objective attainment; Change failure rate; Prevented or automatically mitigated incidents.
Level 3: Optimized
Outcome: Connect system behavior to business outcomes and automate safe, high-confidence action.
Common practices
- Link service health to revenue, transactions, productivity, or customer experience.
- Observability automation: automate diagnosis and remediation where controls and rollback paths are proven.
- Use trends and forecasts to guide investment, capacity, and product decisions.
Useful measures: Business impact of incidents; Automated resolution rate; Cost per reliable transaction or service.
4. Assessment Dimensions
Score each dimension from 0 to 3 using evidence from critical services. Avoid averaging material gaps. A weak foundation can limit progress in later capabilities.
| Dimension | Evidence to review | Score |
| Telemetry and coverage | Signals cover critical services and user journeys, with consistent context. | 0 1 2 3 |
| Service ownership | Teams can identify owners, dependencies, support paths, and business criticality. | 0 1 2 3 |
| Detection and response | Alerts are actionable, impact-based, routed correctly, and supported by tested playbooks. | 0 1 2 3 |
| Reliability management | Teams use objectives, risk signals, capacity information, and learning reviews. | 0 1 2 3 |
| Engineering integration | Delivery pipelines and development workflows use observability evidence. | 0 1 2 3 |
| Business alignment | Leaders connect technical health to customer, operational, or financial outcomes. | 0 1 2 3 |
| Automation and intelligence | Teams automate repetitive analysis or remediation with safety controls. | 0 1 2 3 |
| Governance and enablement | Shared standards, training, communities, and decision rights support adoption. | 0 1 2 3 |
| Evidence beats opinion. Use service records, telemetry coverage, alert history, incident data, delivery metrics, and user-experience measures to support each score. | ||
Scoring Guidance
- 0: Capability is missing or inconsistent.
- 1: Teams use the capability for selected services, often through manual effort.
- 2: Most critical services follow a defined and measured practice.
- 3: Teams apply the practice broadly, automate it where appropriate, and improve it using outcomes.
5. Improvement Roadmap
1. Define the Purpose
Choose the value path that best matches the current business priority. Name the sponsor and the outcomes the organization wants to improve.
2. Establish a Baseline
Assess critical services and document evidence, risks, dependencies, and gaps. Keep the first assessment small enough to complete within a few weeks.
3. Select a Focused Improvement
Choose one or two capabilities with a clear owner, measurable benefit, and realistic delivery window. Foundation gaps usually take priority.
4. Standardize and Enable
Publish reusable instrumentation, alerting, dashboard, and service-objective patterns. Provide examples, training, and office hours.
5. Measure and Adapt
Review progress on a regular cadence. Compare capability measures with service and business outcomes, then adjust the roadmap.
Example 90-day Plan
| Period | Focus | Output |
| Days 1 to 30 | Baseline critical services and agree on the value path. | Assessment, owners, outcome measures |
| Days 31 to 60 | Implement one reusable pattern and close the highest-risk foundation gaps. | Standard, pilot, training material |
| Days 61 to 90 | Expand the pilot, review results, and approve the next improvement cycle. | Measured results and updated roadmap |
What Progress Actually Looks Like
A maturity model is only useful if it changes how teams work. Progress on this framework is not marked by the number of tools deployed or dashboards built, but by shifts in day-to-day practice. When a team is genuinely moving toward observability at scale, a few signals tend to show up together:
- Teams spend less time searching for data during incidents.
- Alerts identify customer or service impact and reach the correct owner.
- Incident reviews produce completed engineering changes, not recurring action lists.
- Service objectives guide release and reliability tradeoffs.
- Leaders can connect observability improvements to measurable service or business results.
|
Practical definition of maturity. A mature organization produces reliable evidence, makes faster decisions, learns from failures, and improves outcomes without depending on a specific vendor or toolset. |
Wherever a team sits on this model, the pattern is the same: purpose first, a dependable foundation next, then focused improvement backed by evidence rather than opinion. Maturity does not arrive with a platform migration or a new dashboard suite. It shows up when the practice around the tooling gets sharper.
Whether you are consolidating toward a unified observability platform or evolving the setup you already have, Crest Data partners with engineering and platform teams to turn assessments into operational practice, from instrumentation and standards to service objectives and safe automation. Contact us to talk through where your observability practice is today and what a focused next step could look like.
Thought Leader: Aditya Khetan