


Modern Security Observability: Why Grafana Data Source Plugins Matter for Observability and Auditing
Modern observability and compliance programs rely heavily on data.
Performance issues, access violations, configuration drift, and security incidents are rarely isolated events.
They are deeply interconnected, and understanding these relationships requires real-time visibility across logs, metrics, traces, and operational events.
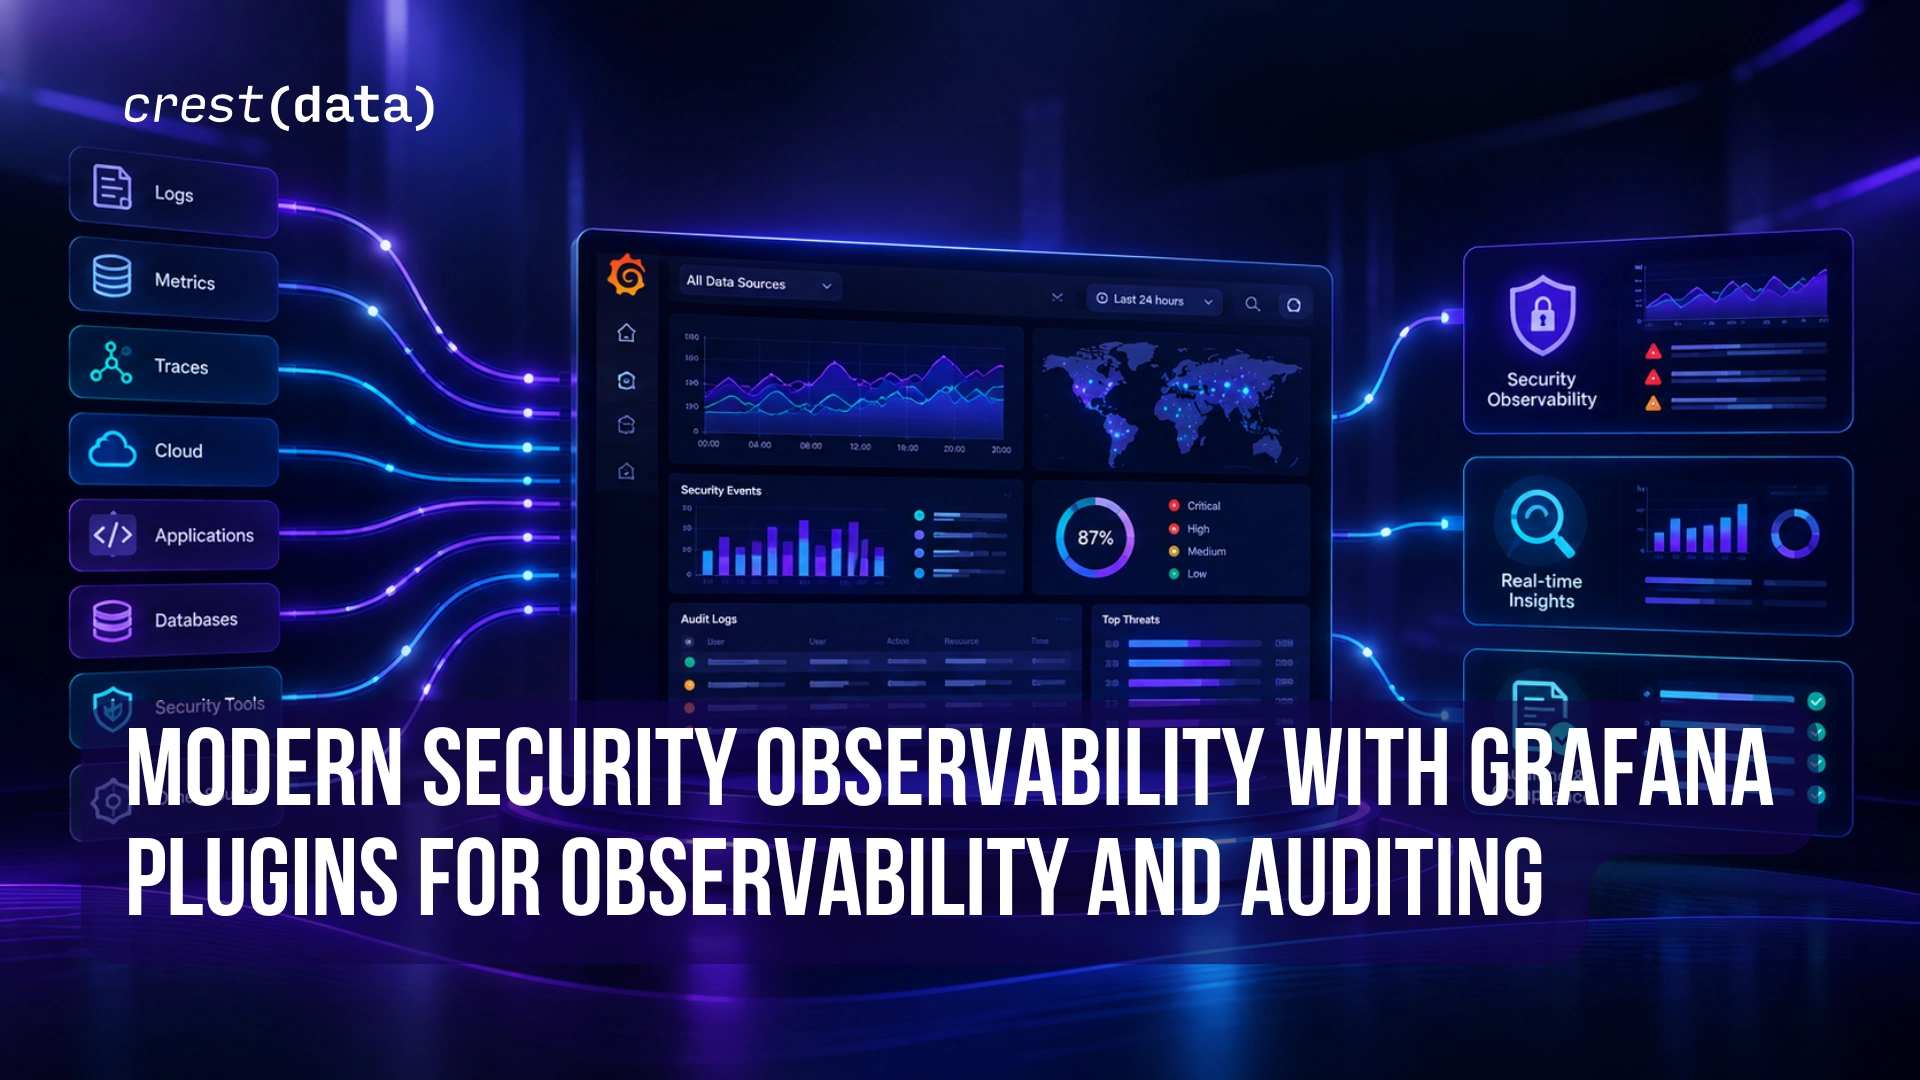
Grafana Data Source Plugins let organizations centralize operational telemetry from enterprise storage, network devices, zero-trust platforms, and collaboration tools into a unified visualization engine. Because they connect to data sources directly, much like a federated search, there is no need to move or duplicate the underlying data, which can also reduce storage costs. Teams can detect risks, investigate incidents, and produce audit-ready evidence across their entire security and IT estate from a single pane of glass.
When built with sound Grafana plugin development best practices, data source plugins turn raw operational and security data into structured, correlated, and actionable insights. This is a big part of how Grafana improves observability for security and IT teams.
Query-In-Place Across Security, Infrastructure, and SaaS Platforms
Rather than forcing organizations to build heavy ETL pipelines or pay expensive data ingestion fees, Grafana’s backend plugin architecture connects directly to native APIs, endpoints, and data lakes using a query-in-place model.
From an observability perspective, Grafana Data Sources fetch real-time telemetry directly from the source system, including:
- Storage performance and capacity metrics from platforms like NetApp ONTAP
- Hypervisor access and configuration events from VMware vSphere
- Zero-trust access logs from brokers like Zscaler Private Access (ZPA)
- Firewall session and threat data from network security devices
- Sharing and activity events from workspace collaboration tools
Because telemetry is queried at the native API level, signals arrive with accurate timestamps, proper source attribution, and rich metadata. This supports both live operational monitoring and strict compliance requirements.
Data Query Processing & Normalization: Standardizing Live Telemetry
Raw telemetry from external APIs is rarely structured the same way. Grafana’s plugin backend and transformation engine let teams to parse, enrich, and normalize data in real time as it is fetched.
Using custom backend data source processors, Grafana normalizes fields such as user identity, host names, IP addresses, service names, and environment parameters across completely different platforms:
- Contextual Correlation: An access event from a zero-trust broker like Zscaler (ZPA) can be visually correlated with storage performance metrics from NetApp ONTAP or hypervisor access logs from VMware vSphere.
- Real-time Sanitization: Sensitive values can be masked or transformed before they render on dashboards, keeping sensitive data within its native compliance boundary.
This normalization layer gives teams a consistent querying interface across disparate APIs, which makes cross-platform threat hunting and long-term compliance auditing far simpler. It is also where well-planned Grafana integration services make the biggest difference.
Visualizations: Unified Platform Dashboards
Grafana platform dashboards provide a unified view across logs, metrics, and events from multiple vendors. SecOps, SRE, and IT operations teams get a single interface to analyze system health, security posture, and compliance status. Following Grafana dashboard development best practices keeps these views fast, readable, and useful during an incident.
From a security observability standpoint, dashboards can display live metrics such as:
- Active firewall session surges and blocked threat vectors
- Storage latency spikes and potential ransomware file-locking behaviors
- Zero-trust user access failures and anomalous geographical logins
- Workspace collaboration metrics and external document-sharing activities
These dashboards also serve as continuous evidence of monitoring. Instead of manually compiling static compliance reports, teams can demonstrate ongoing visibility, review past time ranges, and verify security controls across hybrid environments.
Alerting & Detection Rules: Real-Time Grafana Unified Alerting
Grafana’s unified alerting engine evaluates rules directly against the live data returned by Data Sources, identifying suspicious behaviors, service degradations, and policy violations in real time.
When security detections are evaluated alongside operational infrastructure metrics, teams get richer context, faster root-cause investigation, and fewer false positives.
Why Crest Data for Grafana Data Source Plugins?
Grafana provides a powerful “big tent” visualization framework, but effective security observability depends on how data source plugins handle API rate limits, pagination, data transformation, and dashboard UX. That is where custom Grafana plugin development matters.
Crest Data is a Grafana Marketplace Partner and a launch partner for the Grafana Marketplace. We deliver enterprise-grade, high-performance data source plugins built for leading IT and security platforms.
- 25+ Enterprise Integrations & Marketplace Plugins: Built through dedicated Grafana plugin development to connect storage, network, cloud, and security ecosystems to Grafana.
- Zero ETL / Query-In-Place Architecture: Our plugins eliminate complex middleware and secondary storage costs, taking teams from installation to live visualization in under 5 minutes.
Beyond plugins, our Grafana consulting services and Grafana implementation services help teams plan and roll out observability at scale. Our Grafana migration services support a smooth migration to Grafana, and our Grafana managed services and Grafana support services keep your environment running after go-live.
Crest Data’s Grafana plugins connect enterprise security and infrastructure platforms to Grafana for unified observability, real-time monitoring, and compliance auditing.
Explore Crest Data’s plugins on the Grafana Marketplace or get in touch to bring live-query security observability to your organization.
Frequently Asked Questions
-
A Grafana Marketplace Partner is a vendor that builds and publishes plugins listed on the official Grafana Marketplace, extending Grafana to connect with additional platforms and data sources.
-
A partner brings proven plugin engineering, faster deployment, and experience handling API limits, data normalization, and dashboard design. This reduces the time and risk of building integrations in-house.
-
Grafana unifies logs, metrics, traces, and events from many tools into one interface. With query-in-place data sources, teams can correlate security and infrastructure signals in real time without moving data.