


When sessions are slow, machines are stressed, or connections fail, every minute without answers is a minute of lost productivity across your entire user base. Citrix DaaS generates telemetry across sessions, machines, connections, applications, and configuration operations, but without a unified view, your team is forced to correlate signals across disconnected tools, slowing down every investigation.
The Citrix DaaS integration from Crest Data, available on the Datadog Marketplace, extends Crest Data’s Datadog observability services by bringing all of this telemetry into Datadog so you can monitor your entire virtual desktop environment in one place.
With this integration, you can:
- Detect and diagnose session performance degradation (including slow logons, high latency, and session failures) before users file tickets
- Identify machines under CPU, memory, or I/O stress and correlate resource pressure with user experience impact
- Track connection reliability and pinpoint authentication and brokering bottlenecks by client platform and geography
- Monitor application usage, errors, and faults across your full application catalog
- Maintain a complete, searchable audit trail of every configuration change in your Citrix DaaS environment
Resolve Session Performance Issues Before Users Notice
Session performance is the most visible indicator of user experience in Citrix DaaS, and the hardest to diagnose without correlated data. Slow logons, elevated latency, and unexpected session exits each have different root causes, and chasing them across disconnected tools wastes time you can’t afford.
This integration captures session state, exit codes, logon durations, and client and server latency as they occur, normalized to Datadog’s standard attributes, including fields like usr.name, host, and network.client.ip mean the same thing here as they do across every other data source in your Datadog environment. When average logon duration spikes on a specific machine, you can pivot immediately to that machine’s resource metrics or connection history without rewriting a single query, enabling faster troubleshooting workflows within Datadog and supporting centralized Datadog monitoring services, because the data is already speaking the same language.
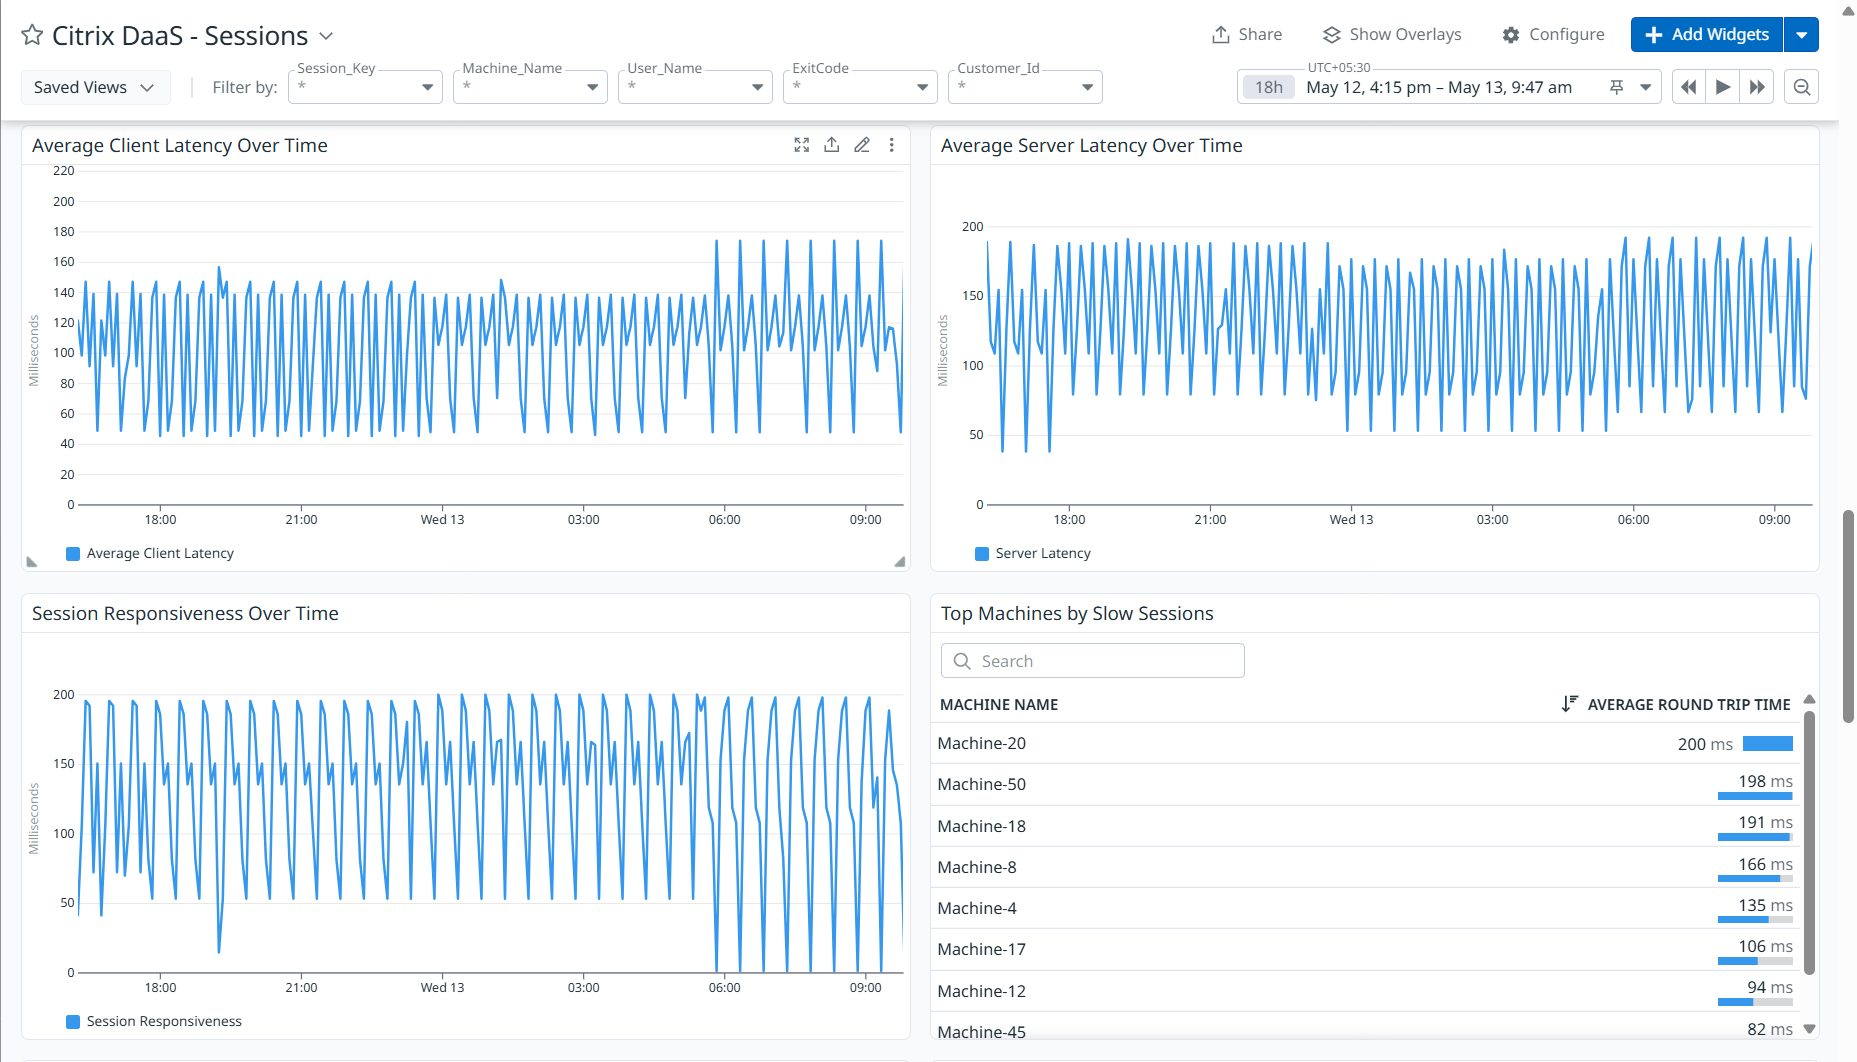
Template variables let you scope the entire session view to a specific desktop group, OS, or machine in one click, so a scoped investigation never requires rebuilding your dashboards from scratch.
Built-in monitors for session logon duration exceeding 1 minute and session failure rate alert your team the moment thresholds are crossed, ensuring slow or failed sessions never go undetected.
Pinpoint Machine Resource Stress Before It Cascades
Resource pressure on a virtual desktop machine rarely stays isolated. A CPU spike raises logon times; high memory pressure increases session latency; degraded I/O performance compounds both. Spotting these relationships before they cascade into a widespread incident requires visibility across all three dimensions simultaneously, which is essential for scalable Datadog infrastructure monitoring.
This integration tracks CPU utilization trends, peak memory usage, IOPS, latency, and logon duration per machine, all enriched with desktop group, OS, and registration status so you know exactly which segment of your infrastructure is under pressure and how many users it affects. When a cluster of machines shows a rising peak CPU alongside an increasing logon duration, the scope of impact is immediately clear.
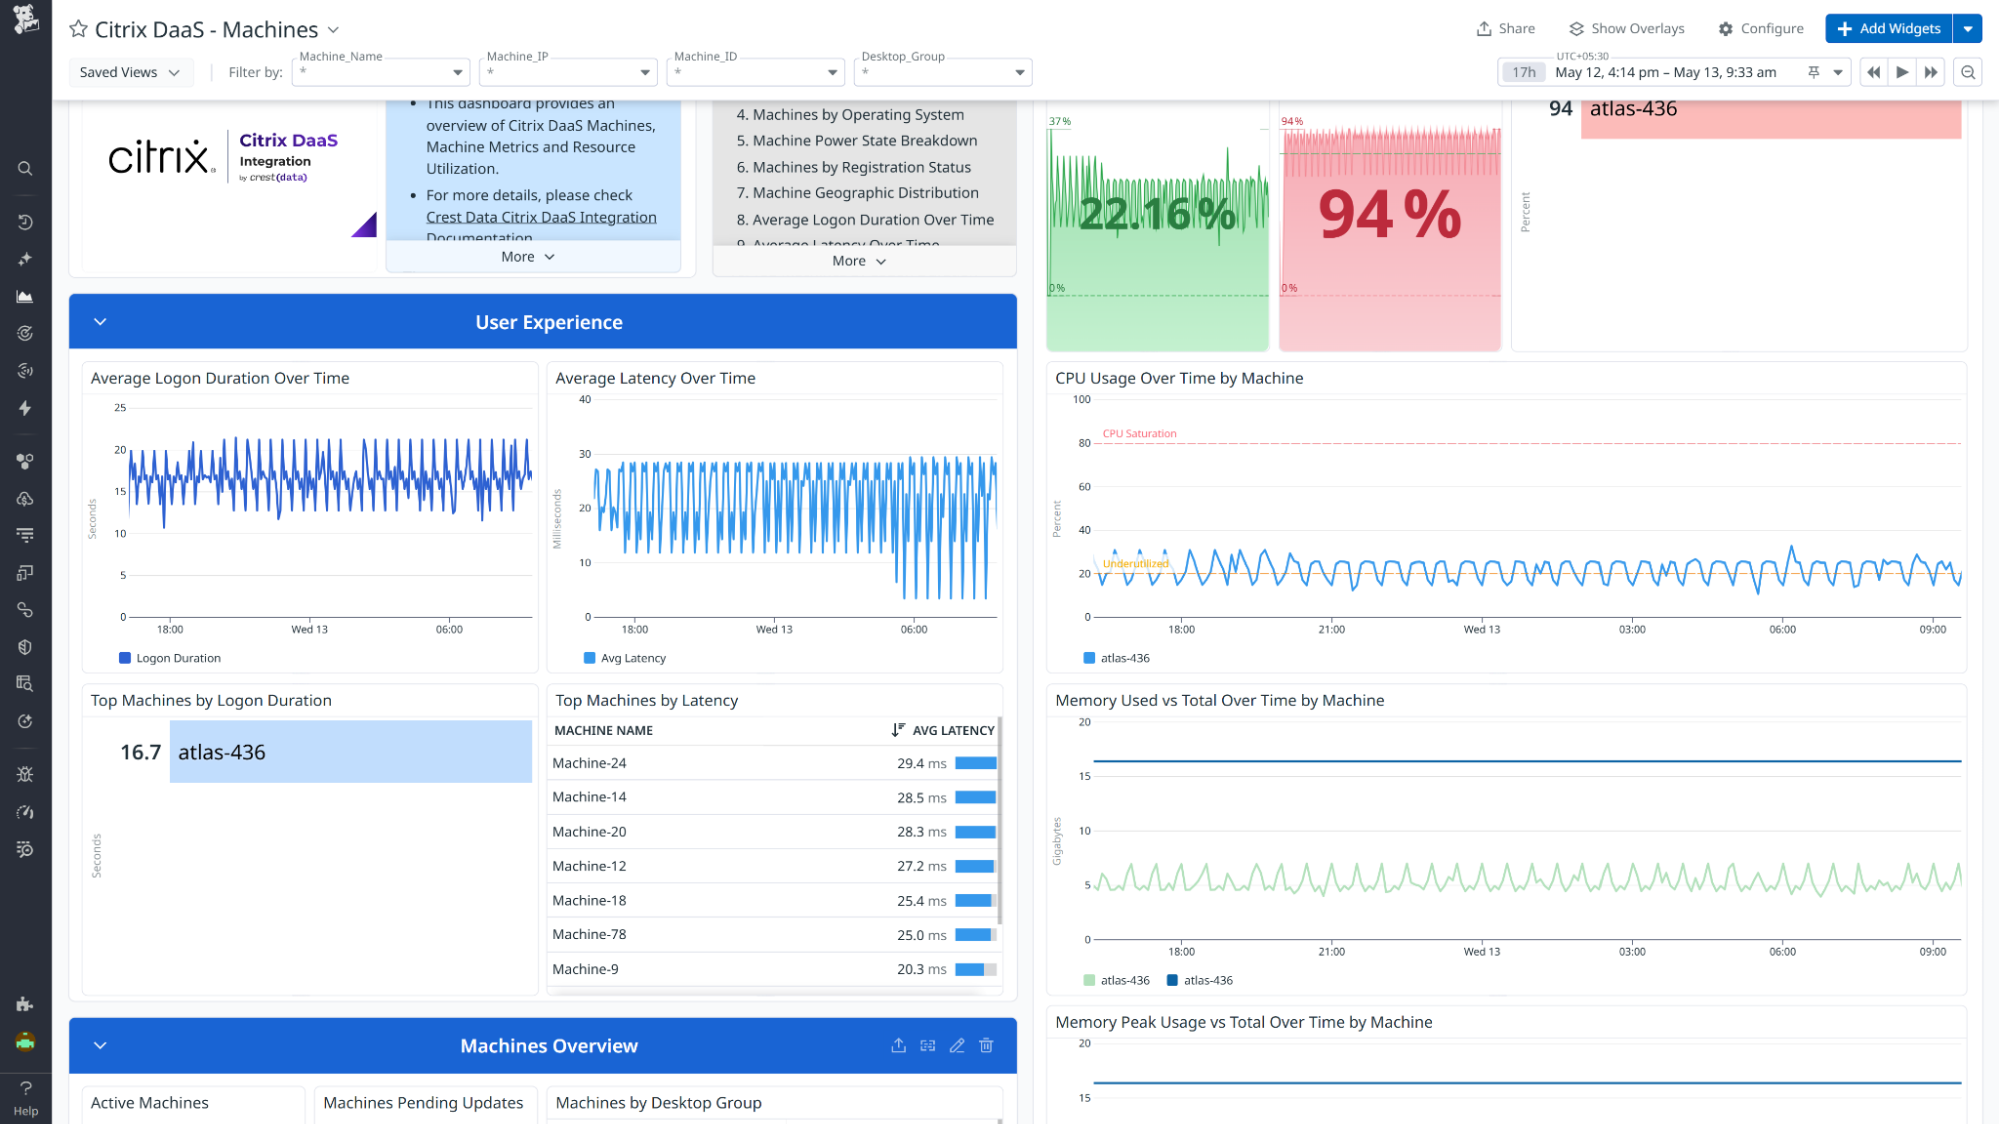
Dedicated monitors for CPU utilization exceeding 90%, memory utilization exceeding 15,000 MB, latency exceeding 5 seconds, logon duration exceeding 1 minute, and machines with zero active sessions on weekdays give your infrastructure team precise, tunable alerting against the operational realities of a DaaS environment.
Diagnose Connection With Full Context
Unreliable connections erode trust in your virtual desktop infrastructure faster than almost any other issue. Reconnection spikes, authentication bottlenecks, and slow connection establishment are all symptoms, and without telemetry tied to client platform, geography, and broker performance, root cause analysis stays slow and imprecise.
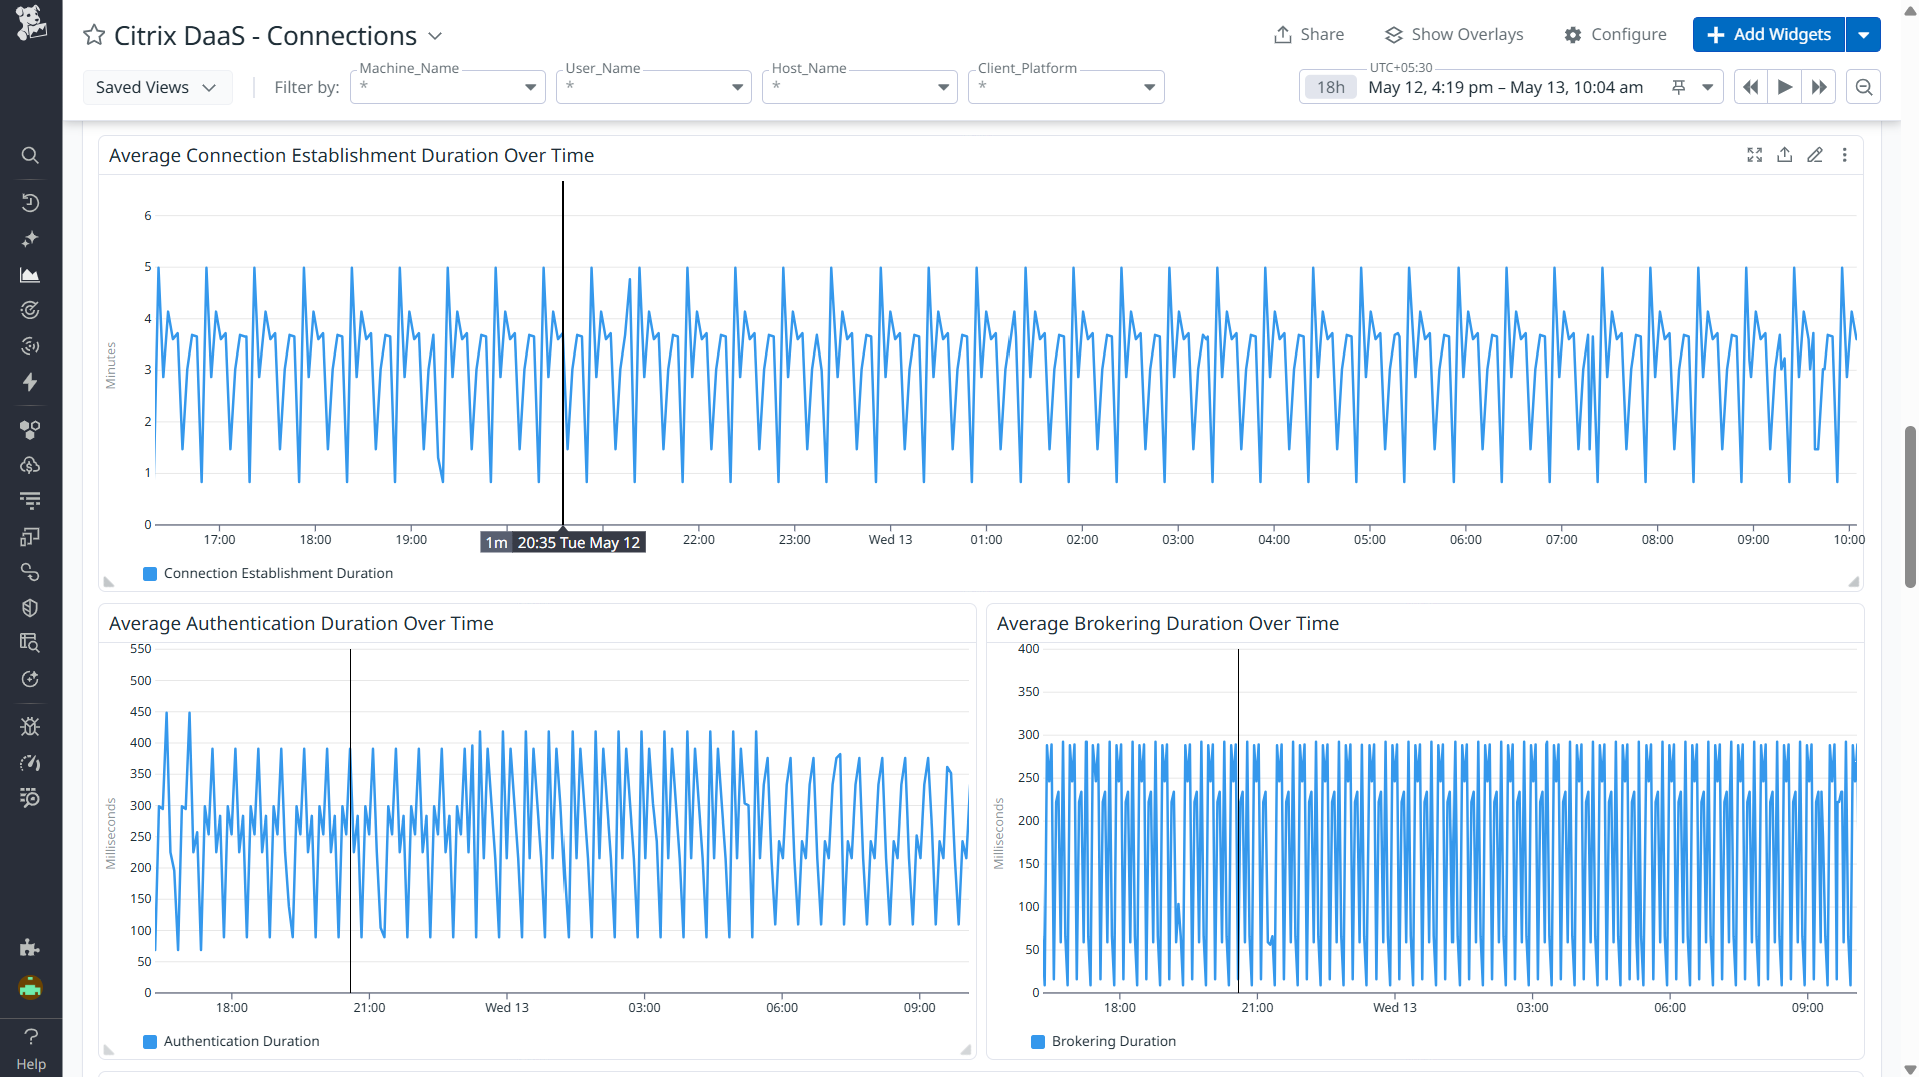
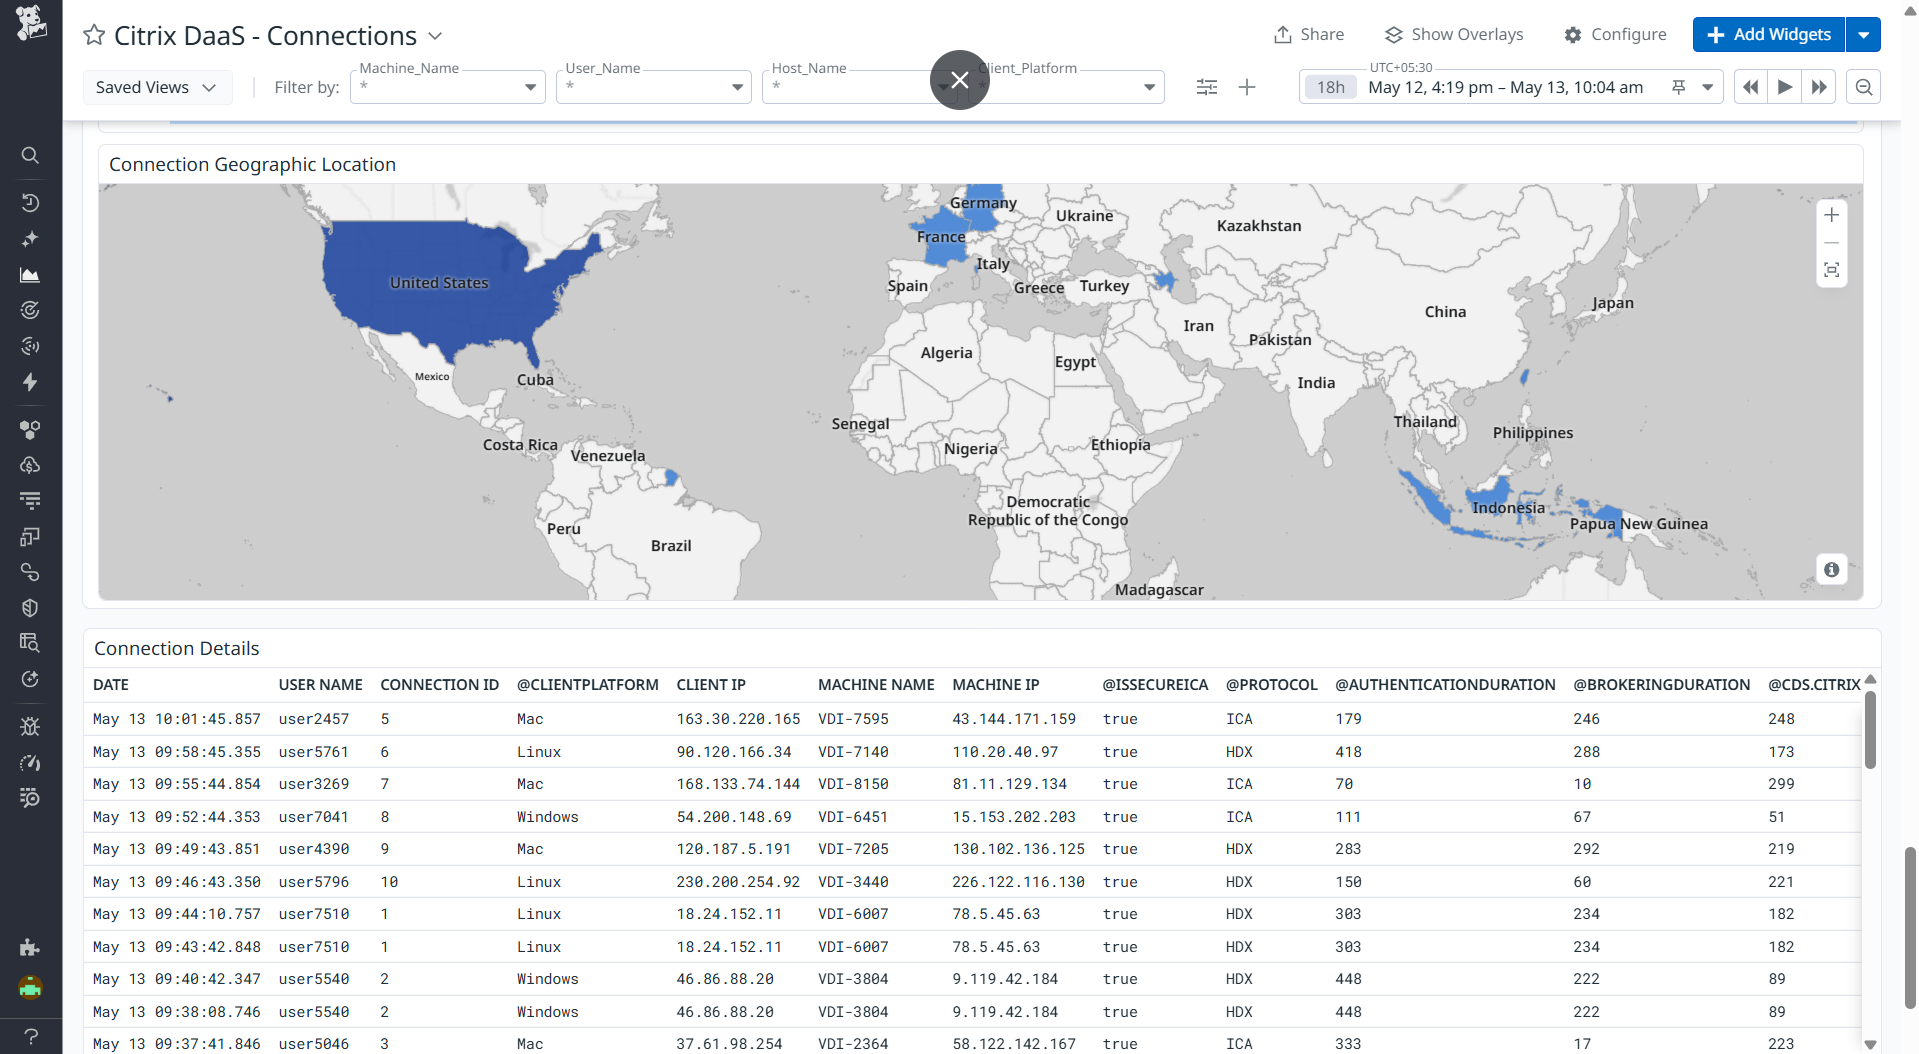
This integration surfaces reconnection rates, non-secure ICA connections, authentication and brokering durations, and slow connections (>1 minute) broken out by client platform, client name, and geographic location. Because all connection events share standardized attributes with session and machine data, a spike in reconnection rate can be cross-referenced against machine registration health or a recent configuration change in seconds, without leaving Datadog or reshaping your data. The “High reconnect rate” monitor fires automatically when reliability degrades, so your team is alerted before the helpdesk queue reflects the impact.
Track Application Usage and Catch Faults Early
Application errors and faults in Citrix DaaS are often silent. Users encounter them, restart the app, and move on without filing a ticket. Recurring faults on specific machines or within specific applications signal deeper instability that compounds over time, reinforcing the need for centralized Datadog application monitoring, but you will only see the pattern if the data is centralized and correlated.
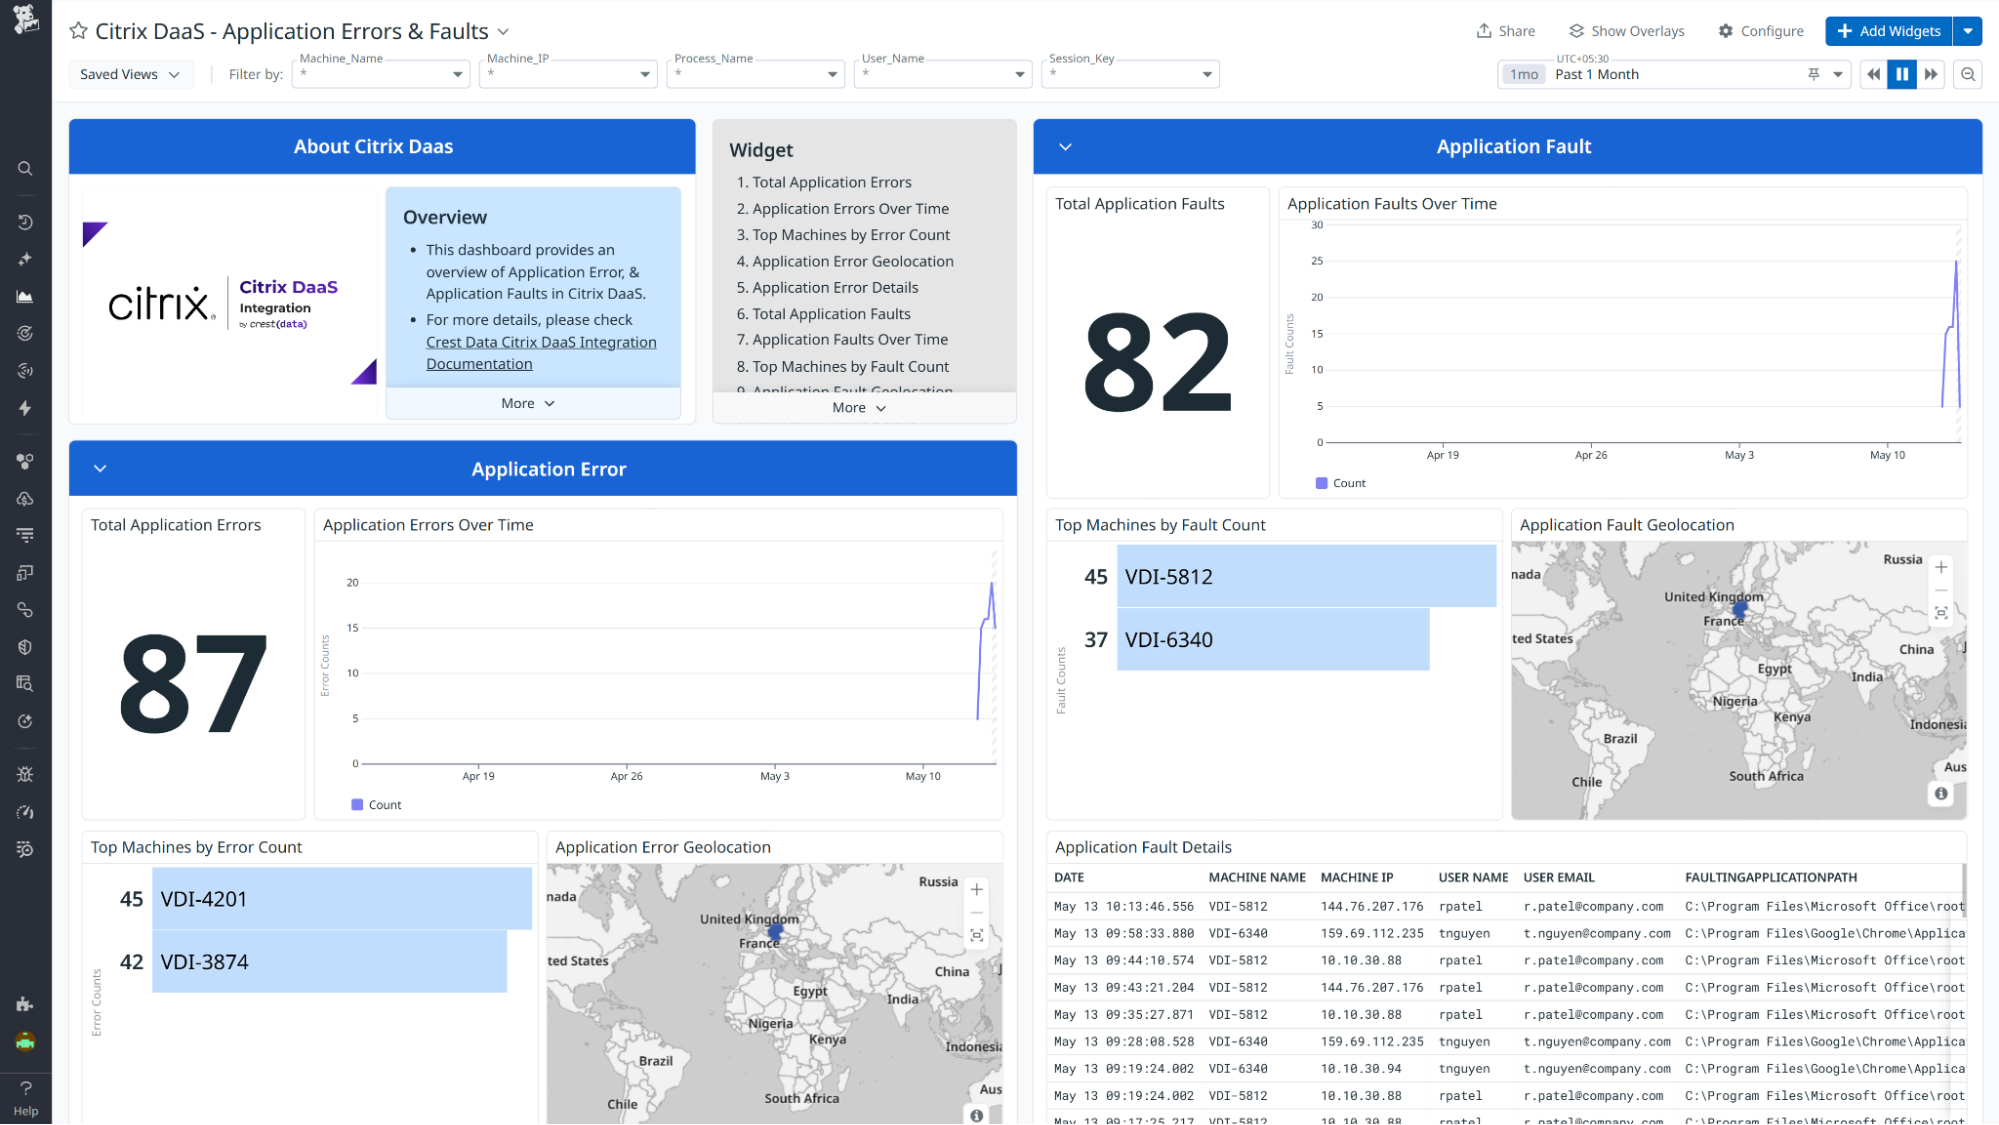
This integration tracks application launch counts, usage durations, peak concurrent instances, error and fault frequency, and the machines generating the highest error counts, all in one place. With template variables scoped to application name, desktop group, or machine, you can instantly isolate whether a fault pattern is tied to a specific delivery group or is infrastructure-wide.
The application inventory view adds lifecycle state, browser, and application type visibility across your full catalog, giving your EUC team the data to rationalize application delivery, enforce lifecycle policies, and identify licenses that are no longer earning their cost.
Audit Every Configuration Change in Context
In regulated environments, knowing who changed what, when, and from where is a compliance requirement. Correlating configuration log operations with operational incidents is difficult, though, when audit data lives outside your observability stack.
This integration brings Citrix DaaS configuration log operations directly into Datadog to strengthen audit visibility through centralized Datadog log management, where every activity event is processed through a log processing pipeline that maps it to Datadog’s standard attributes alongside session, machine, and connection data. When a performance issue follows a configuration change, the relationship surfaces in the same timeline you are already using, improving operational efficiency with integrated Datadog monitoring services, no pivot to a separate audit tool, no manual timestamp matching. Activity by user, operation type, source, status, and administrator machine location gives your security and compliance teams a complete, searchable record within the same platform your engineering teams use every day.
Get Started
Crest Data’s integration for Citrix DaaS monitoring is now available for purchase in the Datadog Marketplace as part of Crest Data’s broader Datadog implementation services and observability solutions portfolio, and includes a 14-day free trial. See our documentation for more information about monitoring Citrix DaaS in Datadog.
Thought Leader: Nisarg Shah