

Skip links
Grafana Marketplace Commercial Plugin

Wiz Plugin for Grafana

Bring Wiz CNAPP security into Grafana


Built for
Wiz
Grafana Labs
13
Query types
7
Bundled dashboards
3
Wiz deployments supported
≥ 13.1
Grafana version supported
Overview

Monitor your Wiz cloud security posture directly inside Grafana

Wiz GraphQL API
OAuth2 service-account authentication
Posture, vulnerabilities, threats, and exposure
Strictly read-only, server-side data access

The Wiz plugin is a backend data source plugin that lets you query and visualize Wiz CNAPP security data directly in Grafana dashboards, Explore, and alerting. Cloud security, platform, and risk teams get posture, vulnerabilities, threats, and exposure in the same dashboards they already use for the rest of their stack.

Wiz is a Cloud-Native Application Protection Platform (CNAPP) that unifies cloud security across posture, vulnerabilities, threats, and exposure. The plugin talks to your Wiz tenant's GraphQL API with a service account and turns the Wiz risk backlog, vulnerability findings, cloud and host configuration posture, Wiz Defend threat detections, network and external exposure, cloud resource inventory, data security findings, scan activity, issue trends, the audit log, and compliance posture into Grafana panels, all read-only and server- side, from a single pane of glass.

Coverage

What You Can Monitor

The plugin exposes 13 query types through the Wiz GraphQL API, selectable in the query editor, with server-side filtering where Wiz supports it (severity, status, cloud platform, action, exploit flags) and a searchable Project dropdown of your tenant's project names so there is no project ID to look up. Snapshot query types ignore the panel time range by design; time-filtered ones expose an Apply Time Range switch.

Risk, Vulnerabilities & Posture

Risk, Vulnerabilities & Posture

Work the Wiz risk backlog as Issues, one row per issue with rule, entity, project, and business-impact context, prioritize CVEs through Vulnerability Findings with CVSS, EPSS, CISA KEV, exploit, and remediation fields, and audit configuration through Cloud Configuration Findings (CSPM, full posture or changes only) and Host Configuration Findings (CIS OS benchmarks with framework and control mapping).

issues CVSS/EPSS CISA KEV CSPM CIS benchmarks
Threat Detection & Exposure

Threat Detection & Exposure

Stream Wiz Defend threat detections as logs with actors, resources, rules, and triggering events, trace Network Exposures between entities with protocols, port ranges, and path hops, and map the External Attack Surface of internet-facing endpoints with pre-aggregated finding and secret counters, to see what is reachable and what is being targeted.

Wiz Defend detections network exposure attack surface secrets
Inventory, Activity & Compliance

Inventory, Activity & Compliance

Inventory the estate from the Wiz Security Graph with Cloud Resources, surface Data Findings (DSPM) with classifier, cloud account, and match counts, track Scan Activity for connector scans, automations, and analyzer runs, trend Issues over time in Wiz-aggregated buckets, read the administrative and API Audit Log as a stream, and measure Compliance with per-rule pass/fail analytics, a computed compliance percentage, and the framework catalogue.

cloud resources DSPM scan activity audit log compliance
Pre-Built Dashboards

Ready-to-use Wiz dashboards in Grafana

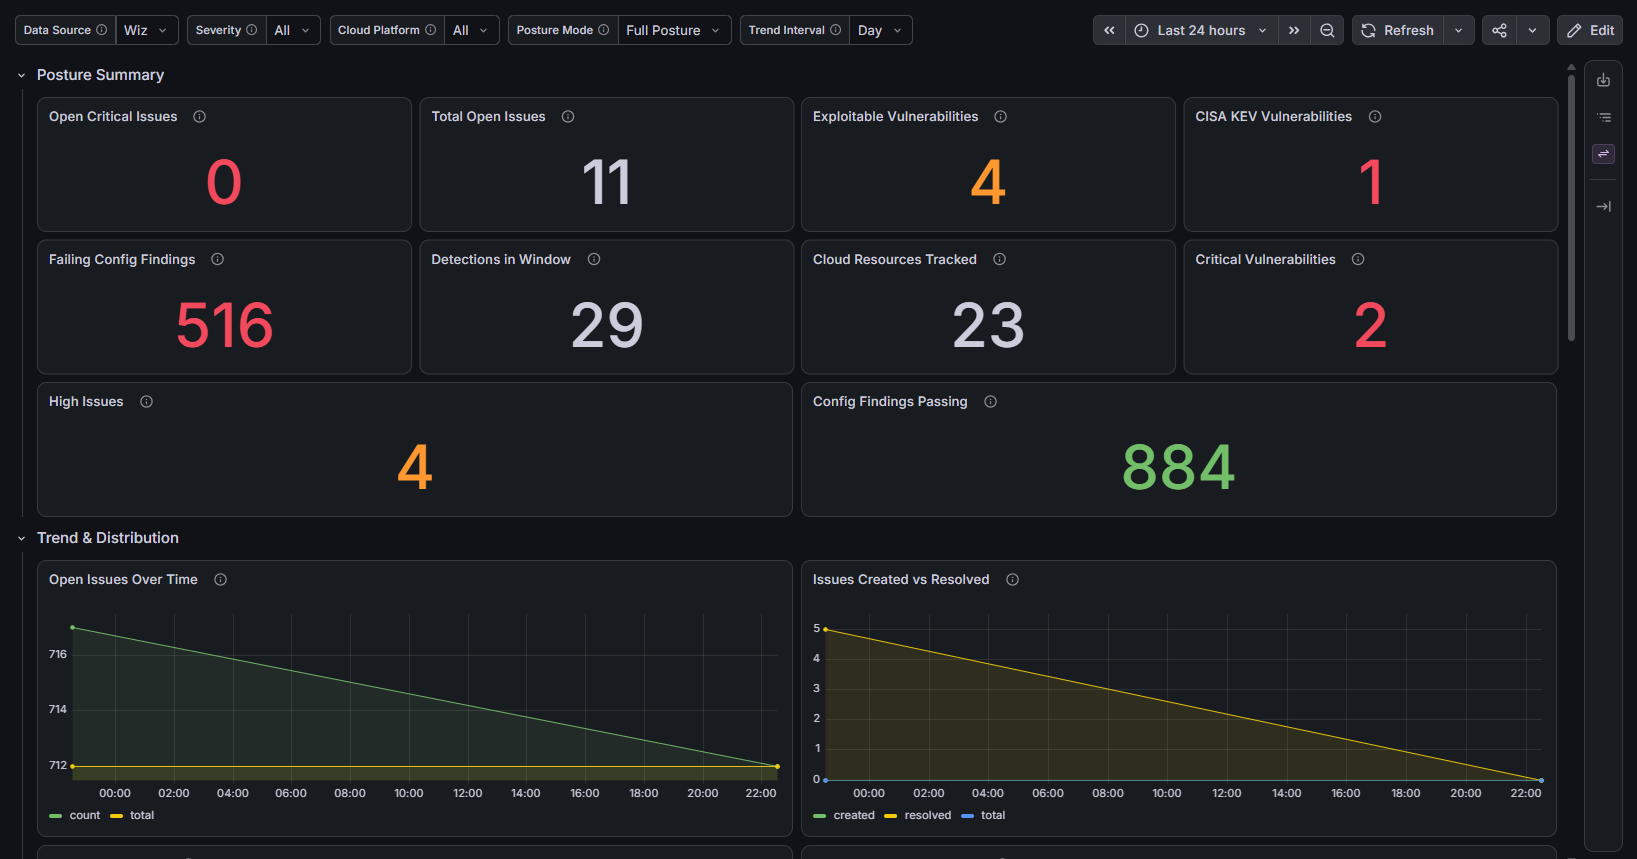
The plugin ships with seven bundled dashboards covering every query type, from an executive security rollup to issues, vulnerabilities, posture, threats, activity, and exposure.
1 / 9
Wiz Security Overview dashboard in Grafana
01

Wiz Security Overview

Cross-domain executive rollup of issues, vulnerabilities, configuration findings, detections, trends, and inventory.
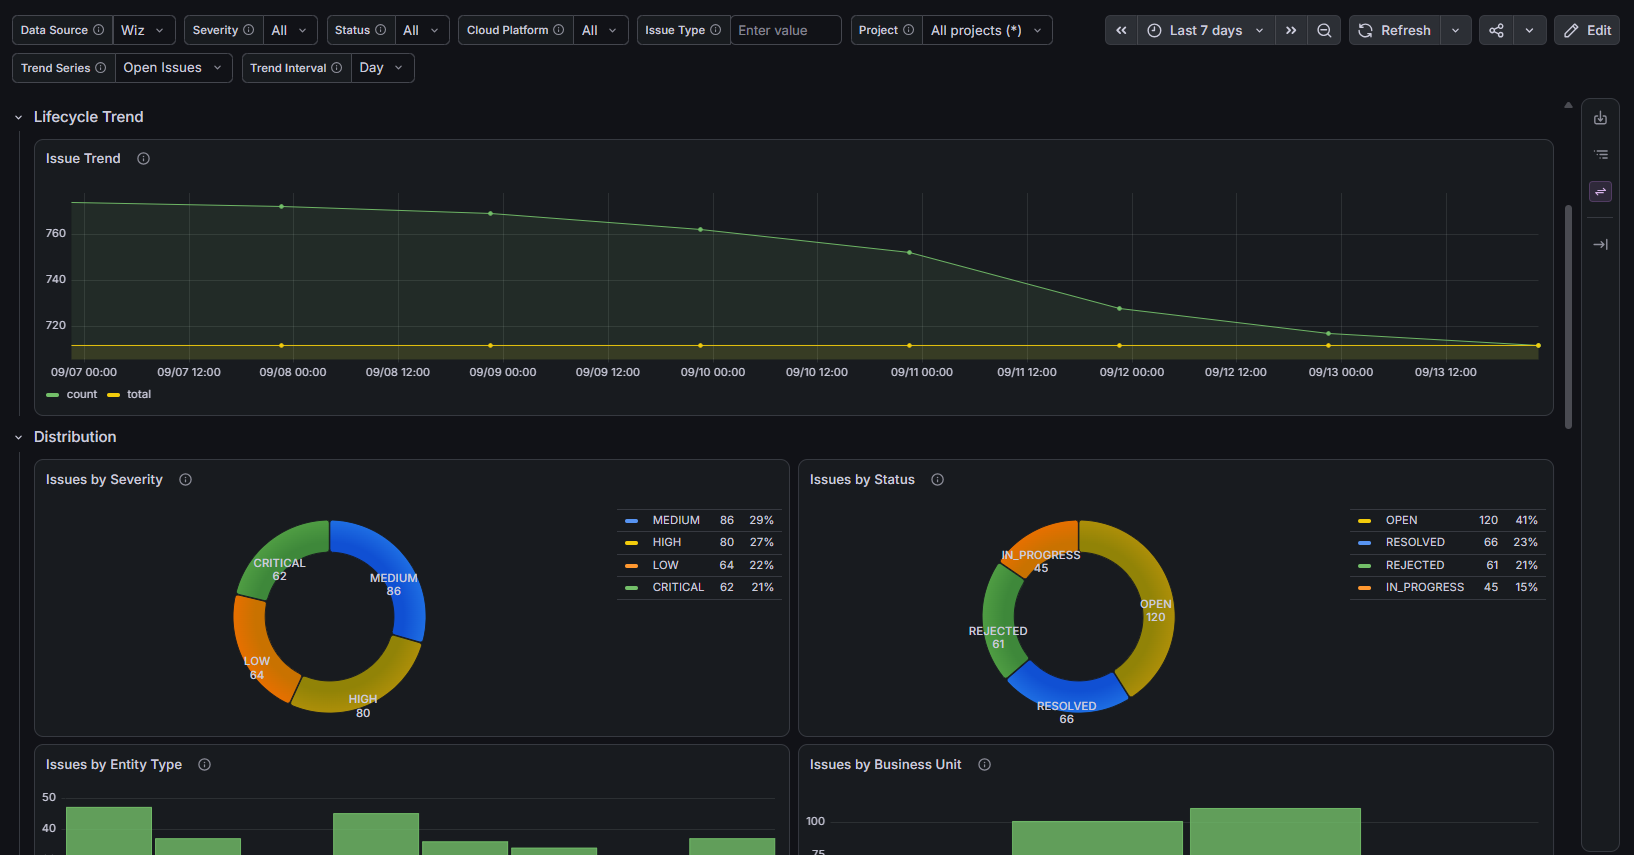
Wiz Issues and Risk dashboard in Grafana
02

Wiz Issues & Risk

Issue lifecycle, severity and status distribution, business-unit and business-impact breakdowns, and due-date tracking.
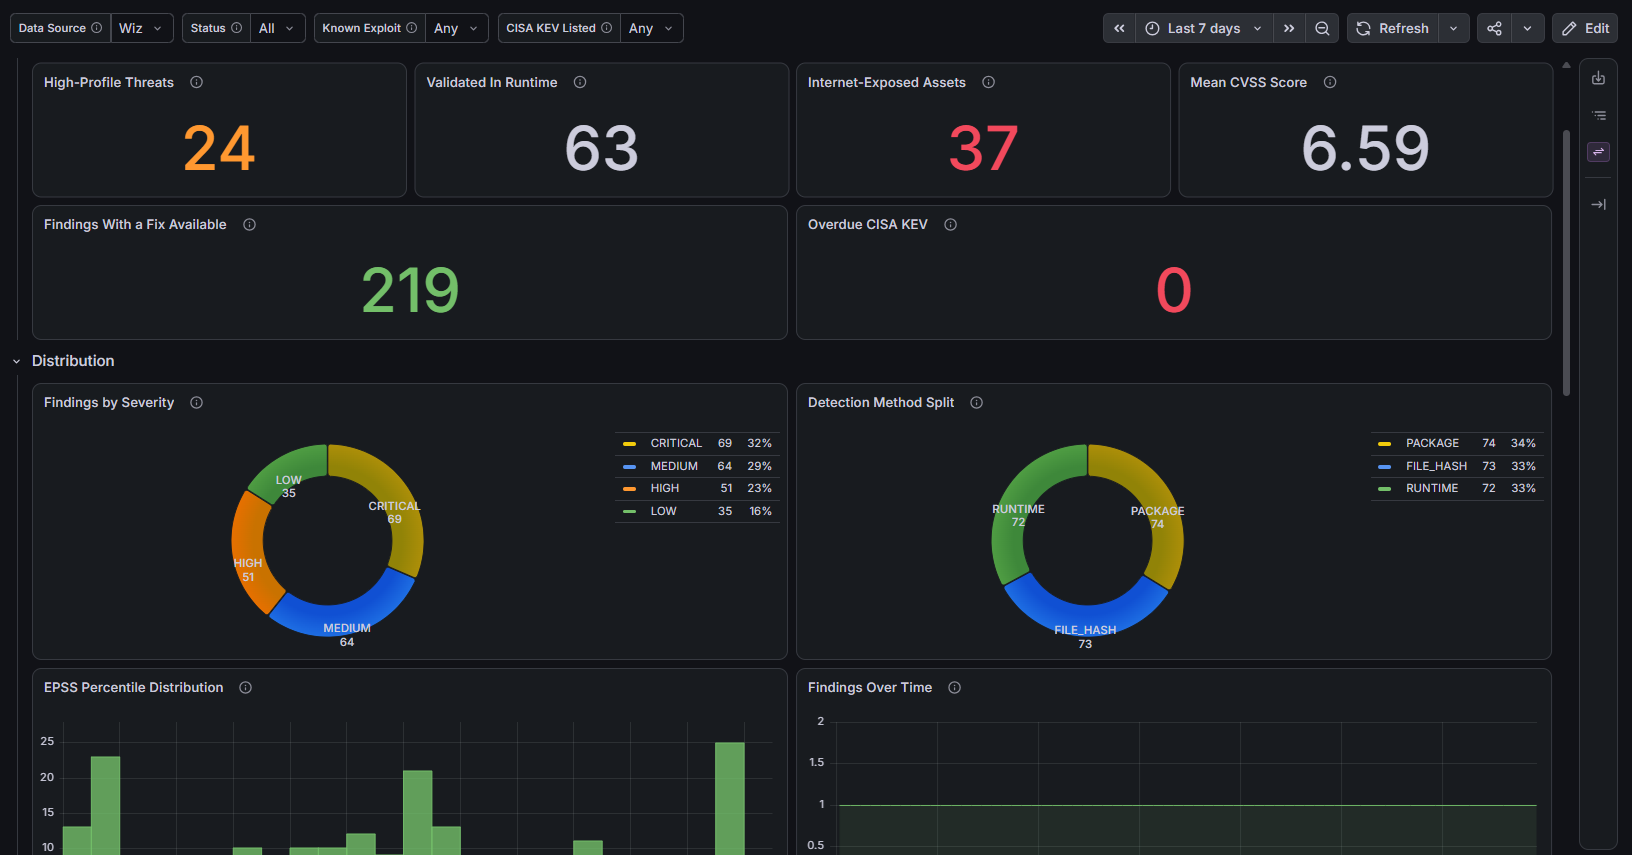
Wiz Vulnerability Management dashboard in Grafana
03

Wiz Vulnerability Management

CVE posture: exploitability, EPSS distribution, CISA KEV exposure, affected assets, and fix availability.
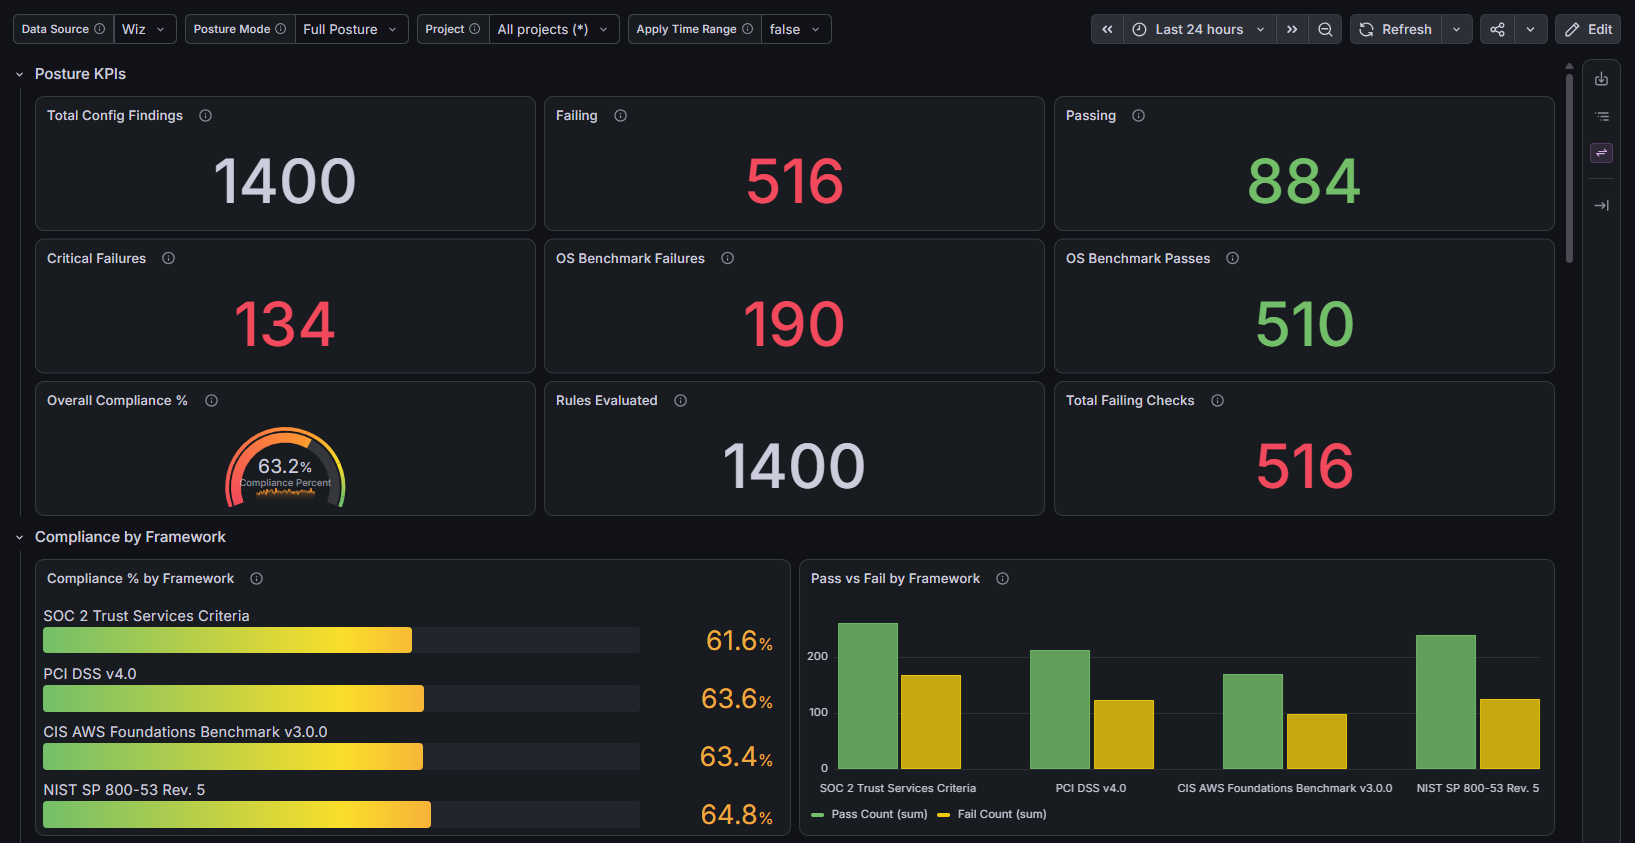
Wiz Cloud Configuration and Compliance Posture dashboard in Grafana
04

Wiz Cloud Configuration & Compliance Posture

Configuration and host benchmark results with framework compliance percentages and remediation evidence.
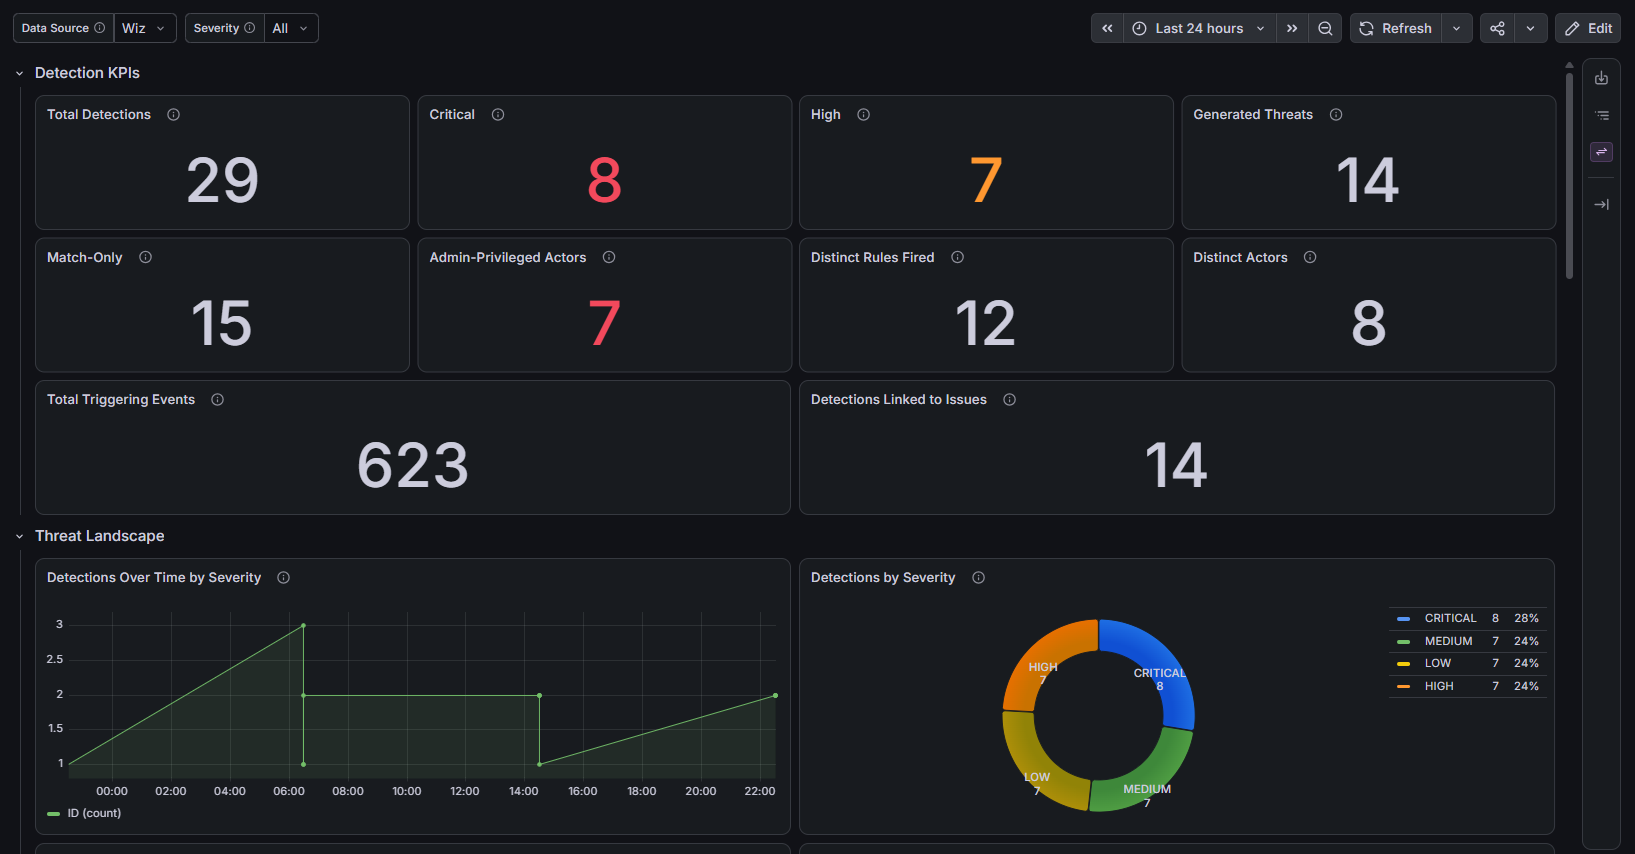
Wiz Defend Threat Detections dashboard in Grafana
05

Wiz Defend - Threat Detections

Detection volume, severity, frameworks, actors, triggering events, and the raw detection log.
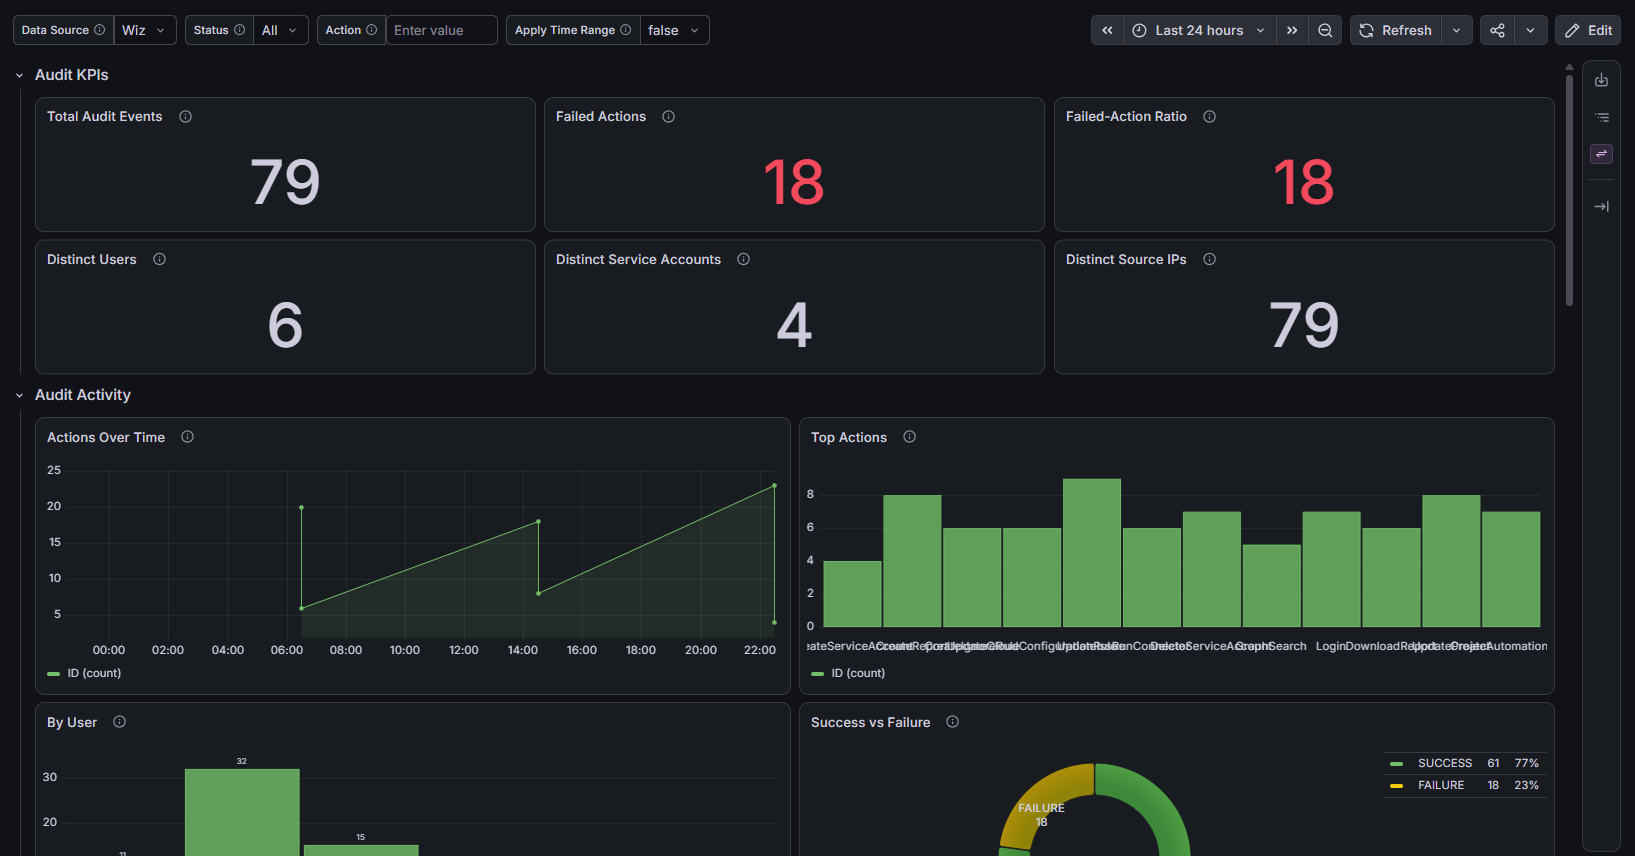
Wiz Audit and Platform Activity dashboard in Grafana
06

Wiz Audit & Platform Activity

Administrative audit trail plus connector, scan, and automation activity health.
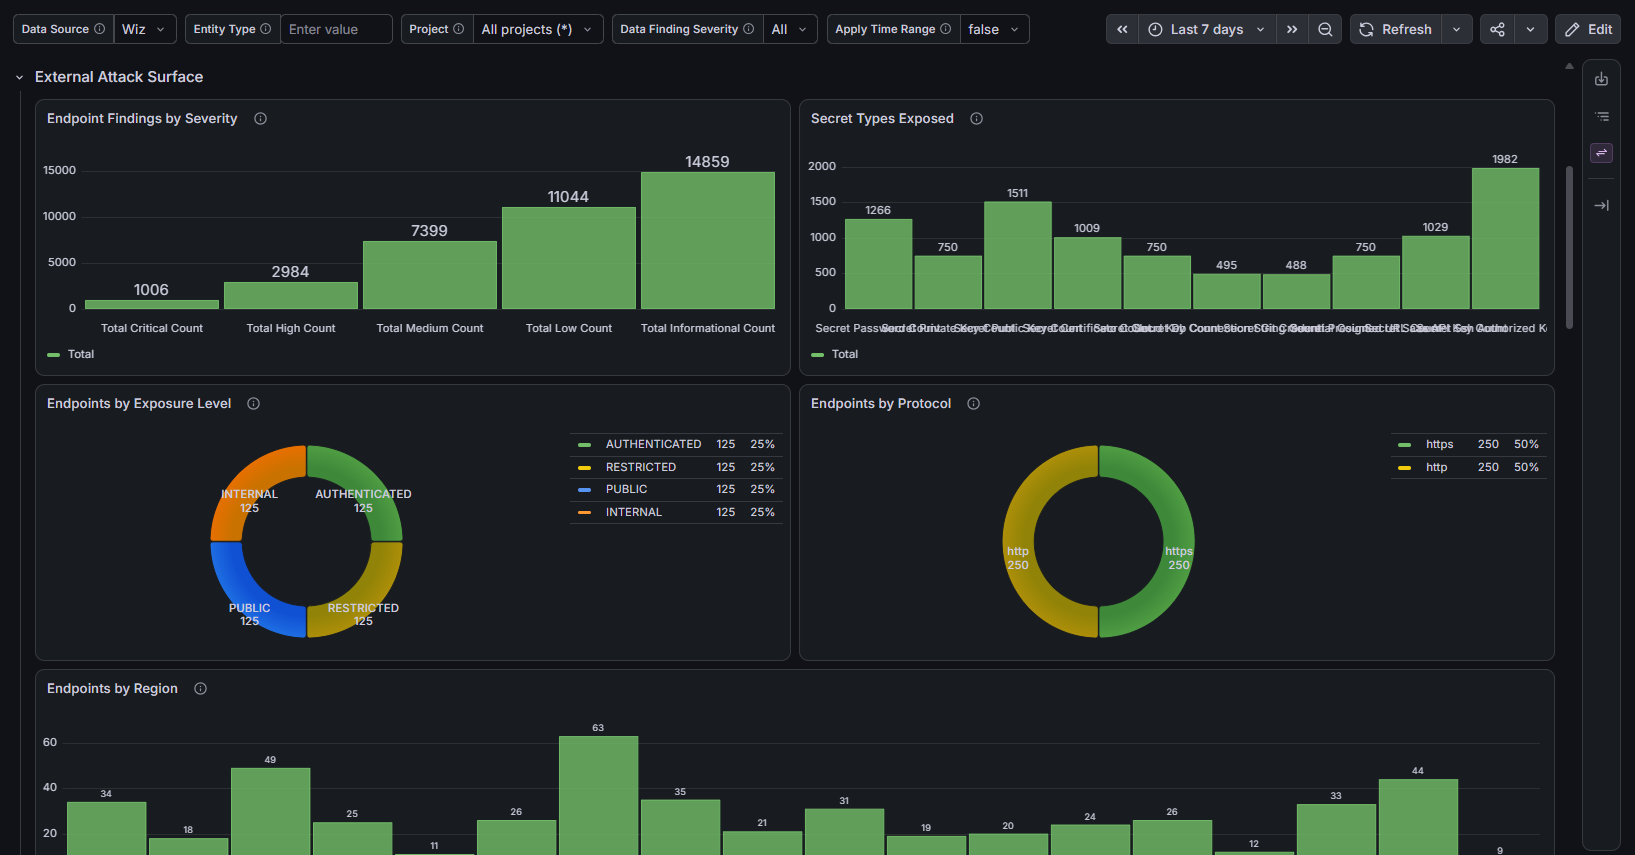
Wiz Exposure and Attack Surface dashboard in Grafana
07

Wiz Exposure & Attack Surface

Network exposure paths, internet-facing endpoints, cloud inventory, and data security findings.
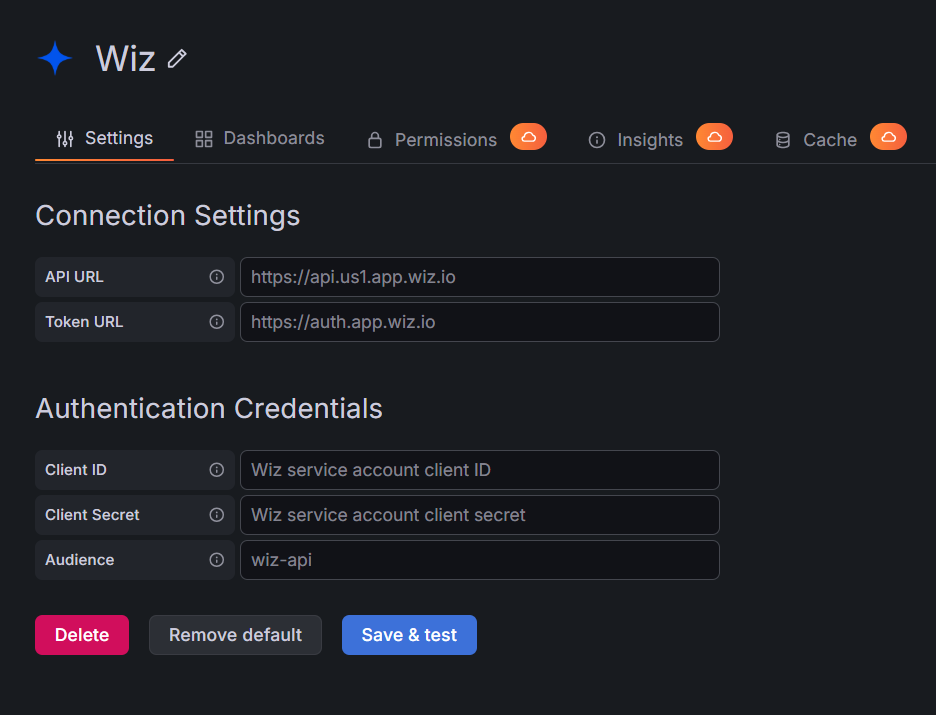
Wiz data source configuration in Grafana
08

Data Source Configuration

Enter your tenant's API URL and Token URL with the service account Client ID and Client Secret, then select Save & test. It issues one authenticated GraphQL request, verifying both the credentials and the service account's read access.
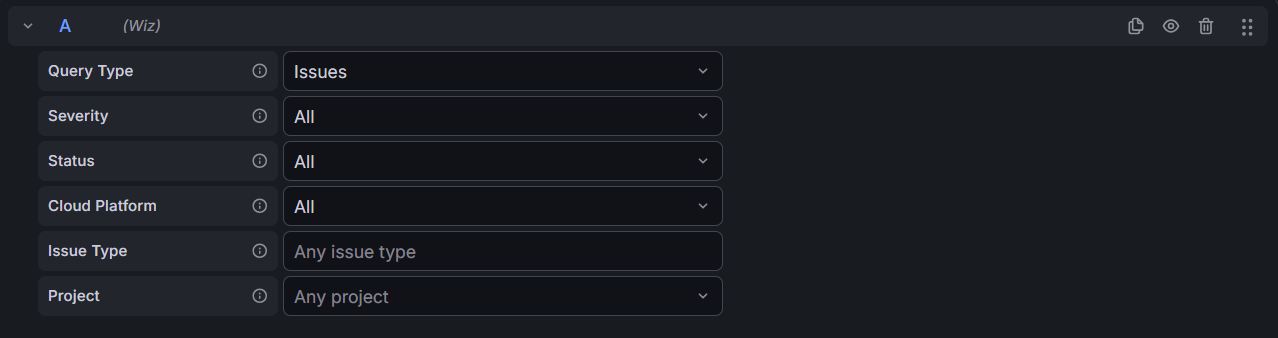
Wiz query editor in Grafana
09

Query Editor

Pick a Query Type first; the editor then shows only the filters that query type supports. Filters left at All or Any are not sent to Wiz.


Differentiators

Why Crest Data's Wiz Plugin?

Native & Agentless

Talks directly to the Wiz GraphQL API with an OAuth2 service account from the Go backend. No agents, no exporters, no extra collection layer to deploy or maintain, and every query is read-only.

Full CNAPP Coverage

Thirteen query types spanning risk, vulnerability, posture, threat, exposure, inventory, activity, and compliance bring the whole Wiz platform into Grafana, so cloud security risk lives alongside the rest of your observability stack.

Project Names, Not IDs

The Project filter is a searchable dropdown of your tenant's real project names; pick a name and the backend resolves it to the Wiz project ID for you, so analysts build correct, scoped queries without memorizing IDs.

Honest Snapshot vs Time-Range Behavior

Snapshot query types (inventory, data findings, compliance, full-posture config) clearly ignore the time picker, while time-filtered ones expose an Apply Time Range switch, so a narrowed range never silently empties a panel.

Complete, Paginated Results

Cursor pagination walks every page Wiz returns with no client-side record limit, with logs frames for detections and audit entries, a pre-aggregated series for issue trends, and a clear notice when Wiz's own graph search reports a truncated result.

Secure & Multi-Cloud by Design

The service-account client secret is encrypted at rest and never exposed to the browser, every query is read-only, and the plugin supports Wiz Commercial, Wiz for Gov (FedRAMP), and Wiz Commercial on GovCloud.

Built and Maintained by Crest Data

Developed and proactively maintained by Crest Data as a commercial Grafana Marketplace plugin, with continuous compatibility as the Wiz API evolves.

How to Get the Plugin

Wiz is a commercial plugin on the Grafana Plugin Marketplace

To license it or set up an evaluation, contact the Grafana Marketplace team.

Contact to Purchase
plugins-marketplace@grafana.com
Plugin ID
crestdata-wiz-datasource
View on the Grafana Marketplace