
Grafana Marketplace
Commercial Plugin
Tanium Plugin for Grafana
Bring Tanium endpoint, vulnerability, and asset data into Grafana

Built for
10
Query types
3
Bundled dashboards
0
Agents or exporters required
≥ 12.3
Grafana version supported
Overview
Monitor your Tanium-managed fleet directly inside Grafana
Tanium API Gateway (GraphQL)
Tanium Cloud and on-prem Tanium Server
Inventory, vulnerabilities, compliance, and assets
Read-only, server-side data access
The Tanium plugin is a backend data source plugin that lets you query and visualize endpoint inventory, vulnerability and compliance findings, unmanaged devices, action oversight, security-agent health, File Integrity Monitoring coverage, the patch catalog, and software asset data from Tanium directly in Grafana. Security and IT operations teams get converged endpoint visibility in the same dashboards they already use for the rest of their stack.
Tanium is a converged endpoint management and security platform. The plugin connects to the Tanium API Gateway GraphQL endpoint to retrieve fleet hardware, OS, and network inventory, CVE and compliance findings, the Discover attack-surface feed, cross-module action and deployment status, endpoint security-agent health, FIM deployment coverage, the patch catalog, and software asset usage, all read-only and all server-side, from a single pane of glass, so teams can track exposure, prove compliance, and manage the fleet without logging into a separate console. It works with both Tanium Cloud and on-prem Tanium Server.
Coverage
What You Can Monitor
The plugin exposes 10 query types through the Tanium API Gateway, selectable in the query editor, with Data View selectors for the two multi-view resources (FIM and Asset) and server-side filtering wherever the Gateway supports it, including optional binding to the dashboard time range.
Endpoint Inventory & Health
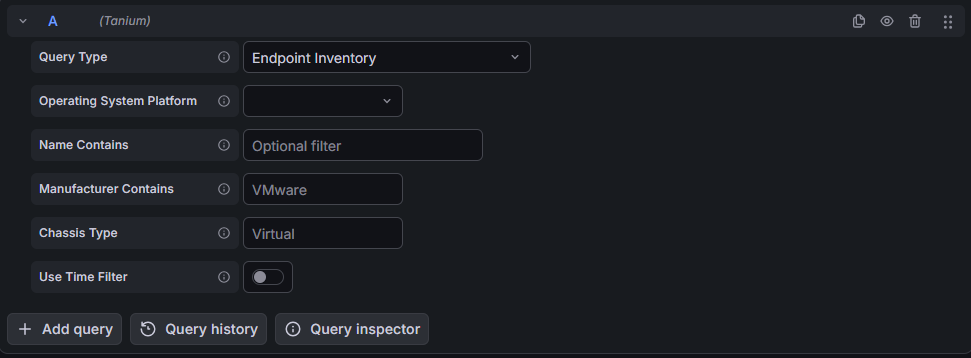
Track fleet hardware, OS, and network inventory with filters for platform, name, manufacturer, and chassis type, and monitor endpoint security-agent health, Windows Defender and SCCM client state, with filters for unhealthy Defender agents and stale AV signatures, to see the state of every managed endpoint at a glance.
hardware/OS
network
Defender
SCCM
AV signatures
Vulnerability, Compliance & Discovery
Surface CVE findings with CVSS, EPSS, and CISA-KEV context per endpoint, CIS/STIG-style benchmark compliance state, the Discover feed of rogue and unmanaged devices, and the Discover label and tag inventory with managed and unmanaged counts, to quantify exposure and attack surface across the environment.
CVE/CVSS
EPSS
CISA-KEV
CIS/STIG
unmanaged devices
Patches, FIM, Assets & Actions
Query the CVE-linked patch catalog with severity, platform, and classification filters, File Integrity Monitoring coverage across monitors and watchlists, software asset inventory across products and per-endpoint assignments, and cross-module action and deployment oversight spanning Deploy, Patch, Guardian, Platform Action, and Playbook Run, to close the loop from finding to remediation.
patch catalog
FIM
software assets
deployments
Playbook Run
Pre-Built Dashboards
Ready-to-use Tanium dashboards in Grafana
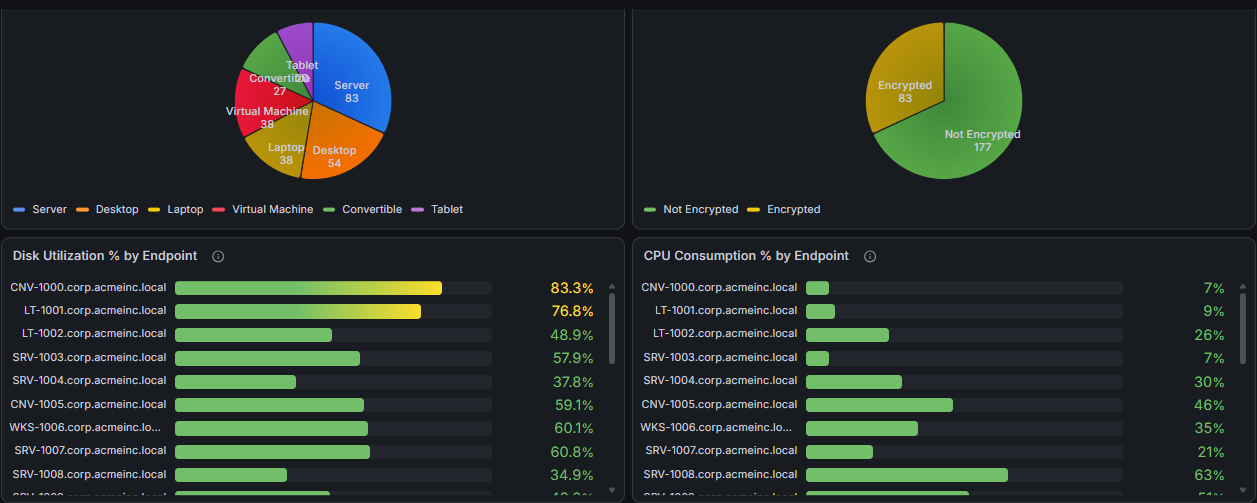
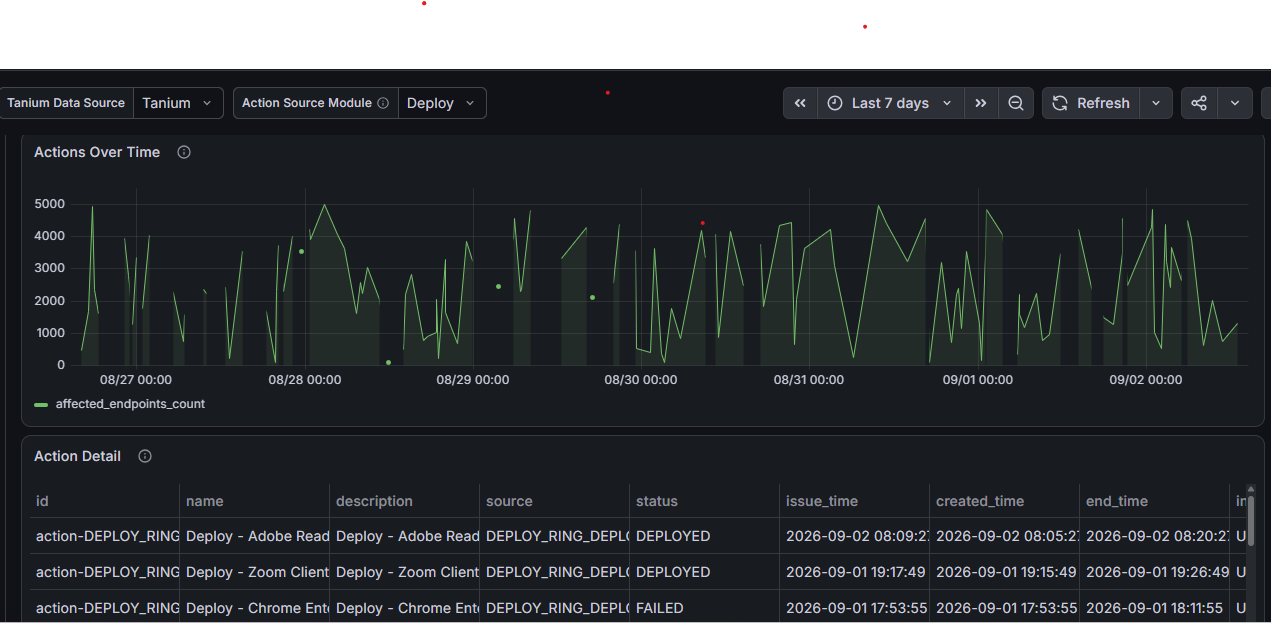
The plugin ships with curated dashboards covering security and exposure, fleet operations, and action and deployment oversight.
1 /
4
01
Tanium Security
Vulnerability and compliance findings, the Discover attack surface, endpoint security-agent health, FIM coverage, and the patch catalog.
02
Tanium Fleet Operations
Fleet hardware/OS inventory and software asset/license inventory.
03
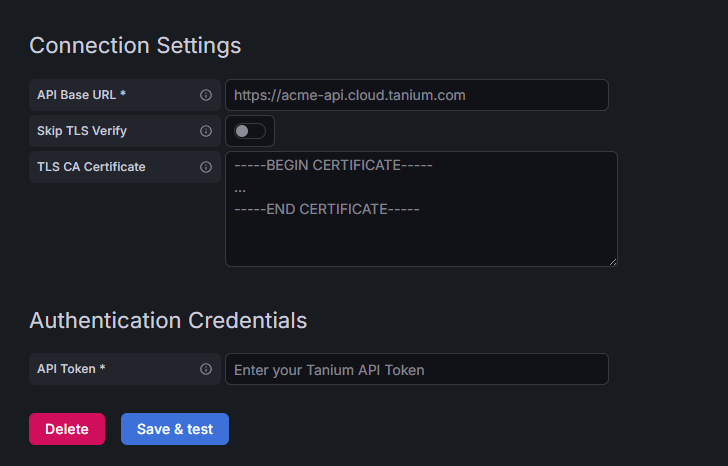
Data Source Configuration
Paste your API Gateway URL into the API Base URL field and your API Token into the API Token field, then click Save & Test. The health check runs a minimal request that requires valid authentication but no solution license.
04
Query Editor
Every query starts with Query Type. Resources with more than one shape of data additionally show a Data View selector, and remaining fields are conditional filters specific to the selected query type.

Differentiators
Why Crest Data's Tanium Plugin?
Native & Agentless
Talks directly to the Tanium API Gateway GraphQL endpoint with an API token from the Go backend. No agents, no exporters, no extra collection layer to deploy or maintain.
Ten Query Types, One Gateway
Endpoint inventory, vulnerability and compliance findings, unmanaged devices, Discover labels, action oversight, security-agent health, FIM coverage, patch definitions, and software assets, converging endpoint operations and security in one data source.
Security & Exposure Focus
CVE findings enriched with CVSS, EPSS, and CISA-KEV signals, benchmark compliance state, the patch catalog, and the Discover attack-surface feed give security teams a real, prioritized view of exposure across the fleet.
Server-Side Filtering & Time Binding
Filters and the dashboard time range are pushed server-side into the Gateway wherever the schema allows, so the Gateway does the work, with an optional Use Time Filter toggle that keeps current-state queries from being emptied by a panel's time window.
Complete, Paginated Results
Exhaustive pagination fetches every page of every connection with no row cap, with post-paging de-duplication on catalogs whose cursors can re-serve rows, so large fleets return complete, clean result sets.
Cloud & On-Prem, Secure by Design
Works with both Tanium Cloud and on-prem Tanium Server, with the API token stored encrypted server-side, every query read-only, and only generic error messages surfaced to the UI.
Built and Maintained by Crest Data
Developed and proactively maintained by Crest Data as a commercial Grafana Marketplace plugin, with continuous compatibility as the Tanium API Gateway evolves.
How to Get the Plugin
Tanium is a commercial plugin on the Grafana Plugin Marketplace
To license it or set up an evaluation, contact the Grafana Marketplace team.
Contact to Purchase
plugins-marketplace@grafana.com
Plugin ID
crestdata-tanium-datasource
View on the Grafana Marketplace