

Skip links
Grafana MarketplaceCommercial Plugin

Cisco Meraki Plugin for Grafana

Bring cloud-managed network telemetry into Grafana


Built for
Cisco Meraki
Grafana Labs
2
Akamai APIs unified
6
Security report views
4
CDN metric categories
0
Agents or exporters required
Overview

Monitor Cisco Meraki with Grafana

Device metrics
Network performance data
Event logs
Cisco Meraki Dashboard API v1

The Cisco Meraki plugin is a backend data source plugin that enables on-demand querying and visualization of Cisco Meraki device metrics, network performance data, and event logs inside Grafana. It connects to the native Cisco Meraki Dashboard API v1 to surface organization, network, and device telemetry across the full Meraki estate.

Meraki is a cloud-managed IT platform spanning wireless, switching, security and SD-WAN, mobile device management, and smart cameras. Network and operations teams get device availability, network and security events, wireless performance, switch port status, WAN uplink health, and site-to-site VPN quality in the same dashboards they already use for the rest of their stack, so they can spot outages, investigate events, and track performance from a single pane of glass.

Coverage

What Can You Monitor

The plugin exposes 11+ Meraki Dashboard API query types, selectable in the query editor, spanning live state and historical trends across the network.

01 — Infrastructure

Device & Infrastructure

Track live device availability and availability changes over time. Monitor switch port status, speed, duplex, and usage, plus appliance WAN uplink status, IP, and ISP details.

device.statusport.statusWAN.uplinkISP
02 — Events

Events & Clients

Query network events across 802.11, DHCP, VPN, and more, alongside IDS/IPS security alerts. Review connected clients at network or device level for complete visibility.

802.11DHCPVPNIDS/IPSClients
03 — Performance

Wireless & VPN Performance

Analyze wireless latency, connection success, and historical client counts. Track site-to-site VPN latency, loss, jitter, and MOS to maintain healthy inter-site connectivity.

LatencyDHCPDNSJitterMOS
Pre-Built Dashboard

A ready-to-use Cisco Meraki Overview

The plugin ships with a bundled Cisco Meraki Overview dashboard that brings the most important signals together in one ready-to-use view, so teams get value without building panels from scratch.
1 / 2
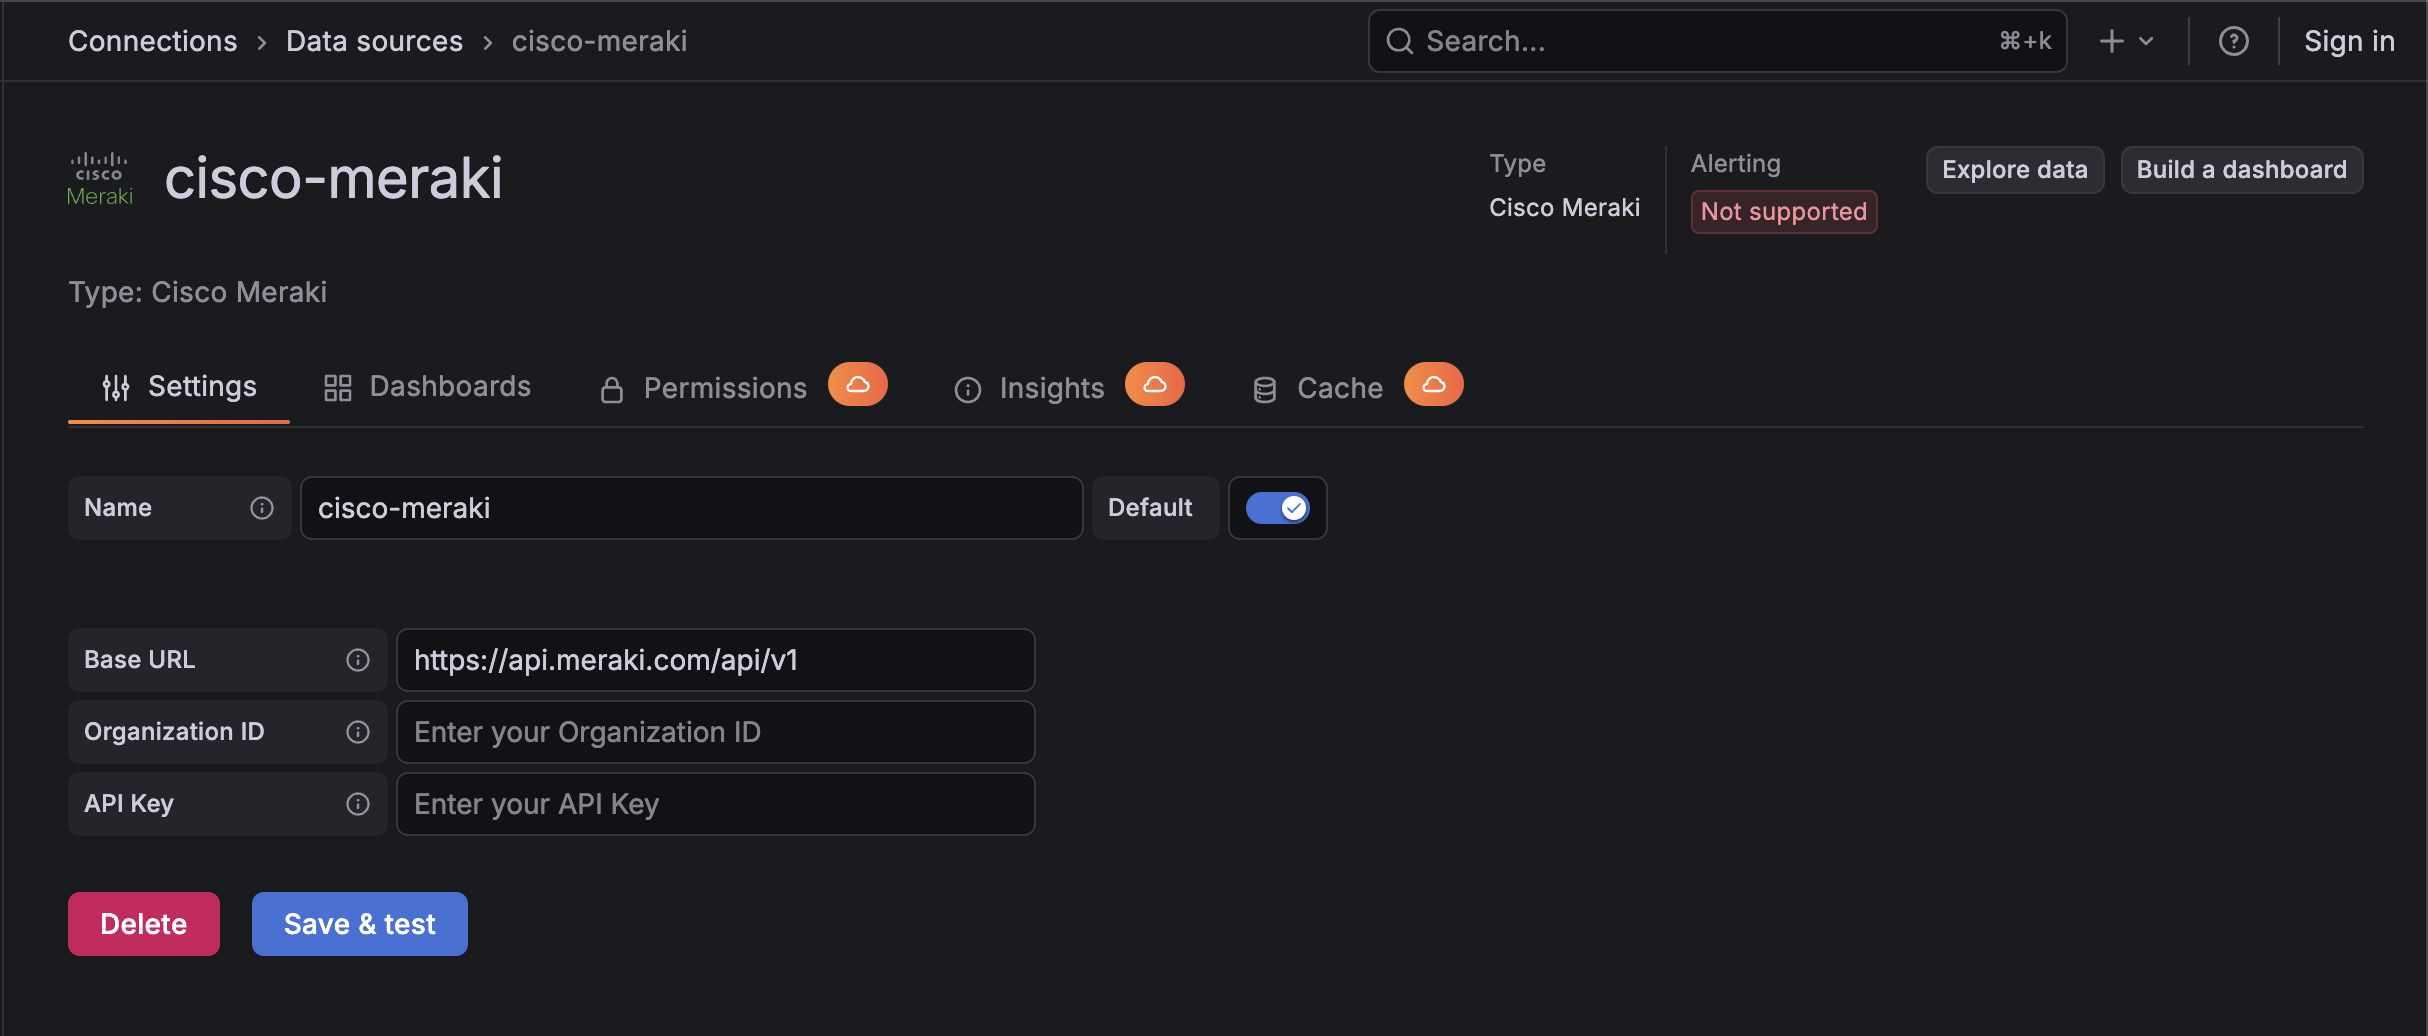
Cisco Meraki plugin data source configuration in Grafana
01

Data Source Configuration

Enter your Meraki Dashboard API key and organization details, then Save & test to connect Grafana to your Meraki environment.
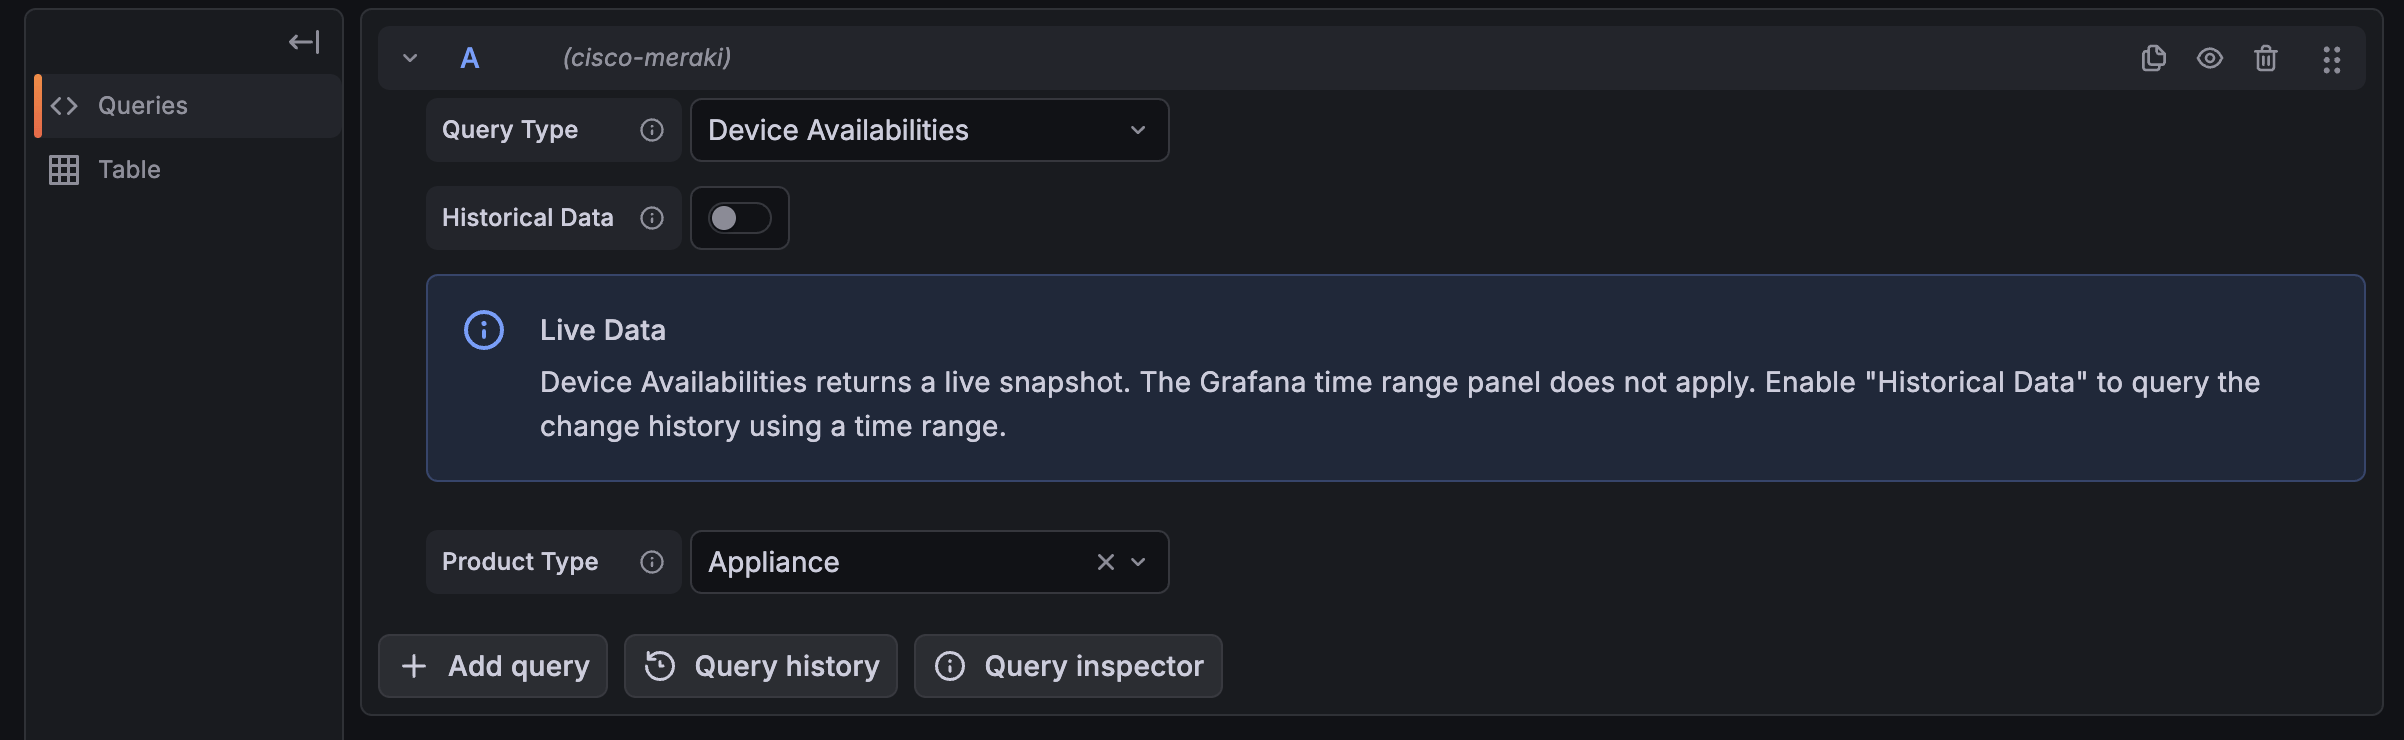
Cisco Meraki plugin query editor in Grafana
02

Query Editor

Select an organization, network, and device to pull the metrics you need using a guided query editor.


Differentiators

Why Crest Data's Cisco Meraki Plugin?

Native & Agentless

Talks directly to the Meraki Dashboard API v1 with an API key from the Go backend. No agents, no exporters, no extra collection layer to deploy or maintain.

Broad Endpoint Coverage

Queries 11+ Meraki Dashboard API endpoints spanning device availability, events, clients, wireless stats, switch ports, uplinks, and VPN, well beyond basic up/down checks.

Live & Historical Insight

Combines live status snapshots (device availability, switch ports, uplinks) with time-series history for availability changes, wireless client counts, and performance trends.

Region-Ready

Configurable Base URL supports regional Meraki endpoints, including Canada, China, India, and US FedRAMP, alongside the global default.

Built for the Meraki API

Honors Meraki's rate limits with Retry-After support and exponential backoff, RFC 5988 Link-header pagination, and per-endpoint time-range validation to prevent invalid queries.

Guided Query Editor

Dynamic dropdowns for Network and Device Serial populate straight from the Meraki API, with inline validation so teams build correct queries without memorizing IDs.

Built and Maintained by Crest Data

Developed and proactively maintained by Crest Data as a commercial Grafana Marketplace plugin, with continuous compatibility as the Meraki API evolves.

How to Get the Plugin

Cisco Meraki is a commercial plugin on the Grafana Plugin Marketplace

To license it or set up an evaluation, contact the Grafana Marketplace team.

Grafana Marketplace
plugins-marketplace@grafana.com
Plugin ID
crestdata-ciscomeraki-datasource
Get the Plugin Now