


This series has followed one arc. Part 1 covered how agents on ServiceNow actually work and why a business rule executes while an agent decides. Part 2 argued that every agent needs a governance gate before it ships. This final part is about what comes after the gate: your agents are live, well-built, properly approved. Now how do you know how they’re actually doing?
There’s a call our team has sat through more than once now. The agentic workflow rollout went well. The demo impressed everyone. The agents are live on ServiceNow, triaging incidents, drafting resolution plans, calling tools in production. Then somebody senior asks a very reasonable question:
“So, how are the agents actually doing?”
And the call goes quiet.
The honest answer, in most organizations we’ve worked with, including several where our team runs the ServiceNow managed services engagement, is that nobody really knows. You know the agents ran. That’s about it. Did they reason well, or wander? Did they pick the right tools, or just retry until something worked? Were they better last month? What does one resolution cost? And when compliance eventually asks why an agent did what it did, what exactly are you going to show them?
Our engineers spend their days inside ServiceNow instances, and over the past year a good part of that has been building and testing agentic workflows. If one lesson keeps repeating, it’s this:
Agents don’t fail loudly. They fail plausibly.
A hallucinating agent and a healthy one look identical in every view the platform gives you today. Both complete their runs. Both return confident answers. The workflow shows green either way. That’s not a small gap. It means you’re handing software the authority to act on your behalf at the exact moment you can’t see how it’s making decisions.
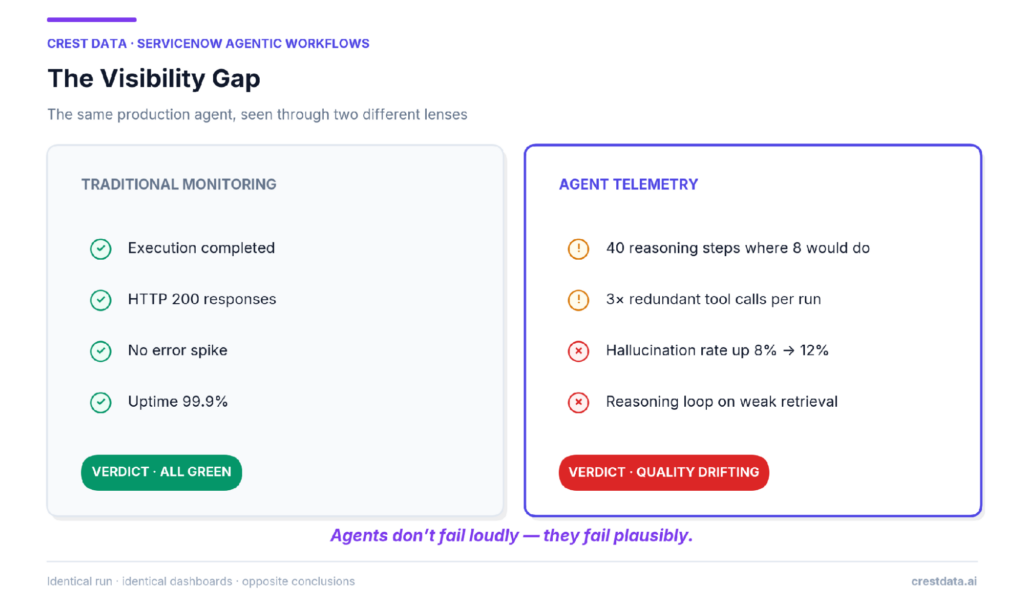
Agentic workflows change what “working” means
We’ve all lived through a version of this before. When enterprises broke monoliths into distributed services, most teams shipped first and only later learned how much visibility they’d given up. Agentic workflows on ServiceNow put us at a similar point, and in our experience, three things make agents genuinely different from any workflow the platform has run before.
1. The unit of work isn’t a transaction. It’s a reasoning episode.
Take one objective, something like “resolve this incident.” Inside an agentic workflow, it fans out into a whole hierarchy: an orchestrating step, agent tasks, think-act-observe loops, tool calls, messages back to the requester. Flatten all of that into a transaction log, and you’ve thrown away the structure you’d need to understand what actually happened.
2. “Success” is not a completed state.
An agent run can complete cleanly and still be a mess. Forty reasoning steps where eight would have done. The same tool called three times. A confident resolution plan grounded in nothing at all. The workflow state is complete, and the business outcome is garbage. Everything we’re used to on the platform measures whether a flow ran. With agents, we have to measure whether the agent thought well. Those are very different jobs.
3. Quality degrades silently, from causes outside your update sets.
A model version update from the provider. A tweaked agent instruction. Someone reorganizes the knowledge base. The mix of incoming tickets shifts. Any of these can move hallucination rates overnight, and none of them shows up as an error anywhere. A business rule behaves tomorrow the way it behaved today. Agents make no such promise, and it takes a while for that to sink in.
There’s a scale problem underneath all of this too. As AI Agent Studio and Skill Studio adoption grows across ServiceNow cloud platform services deployments, execution data from agents and LLM calls grows with it, fast. Every reasoning step, every token, every tool call. The platform’s tables were never meant to carry that volume for deep analysis. Somewhere along the way, this stopped being an audit-trail question and became a data engineering question.
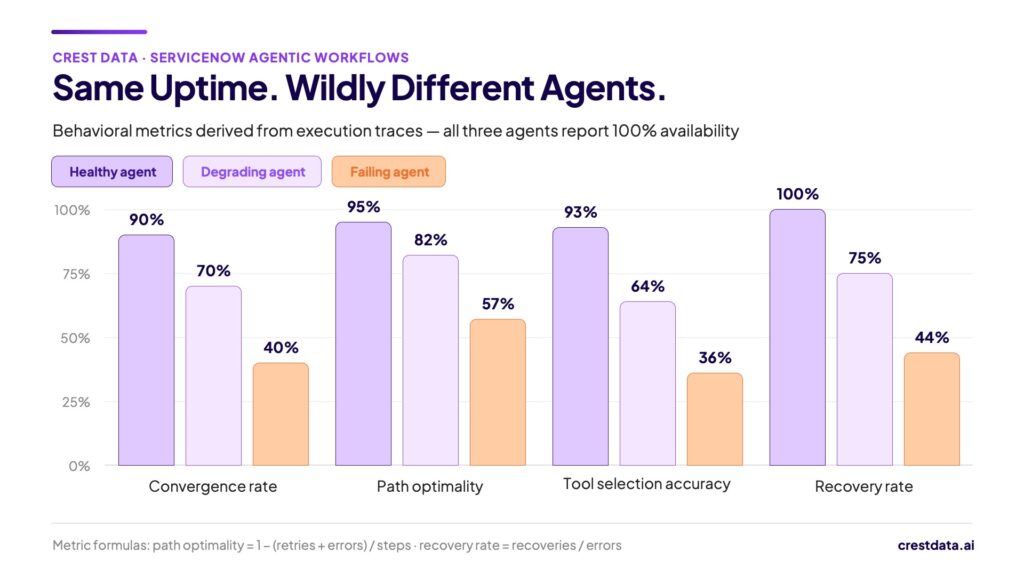
Three agents. Identical completion rates. One is excellent, one is quietly decaying, one is broken. Only behavioral data from their execution traces can tell them apart.
Platform logs weren’t built for reasoning
ServiceNow gives you plenty of records about what ran: transaction logs, flow execution contexts, system logs, audit history. They answer “did it execute” and “who touched what.” What they can’t answer is the question that actually matters with agents: was the output any good? Was the plan grounded in the knowledge that was retrieved? Did the reasoning hold together? Did the answer drift from what the requester actually asked for?
Working through this on our own projects, and on the ServiceNow managed services work our team runs day to day, we landed on a simple position: quality has to become data. Groundedness, relevance, hallucination, safety scored per run and stored right next to the execution records, so you can query and trend them like anything else on the platform.
That’s the conviction behind the framework we’ve been prototyping in our labs. It isn’t a product you can download today; it’s a working proof of concept, and the lessons from building it are what this post is really about.
Three layers, from raw traces to real answers
We built the proof of concept as a native ServiceNow scoped application on the Now Experience UI Framework, a fairly standard ServiceNow application development pattern taken in a very non-standard direction, with insights surfacing as UI Builder components in the workspaces where platform teams already spend their day. Under the hood, three layers do the heavy lifting.
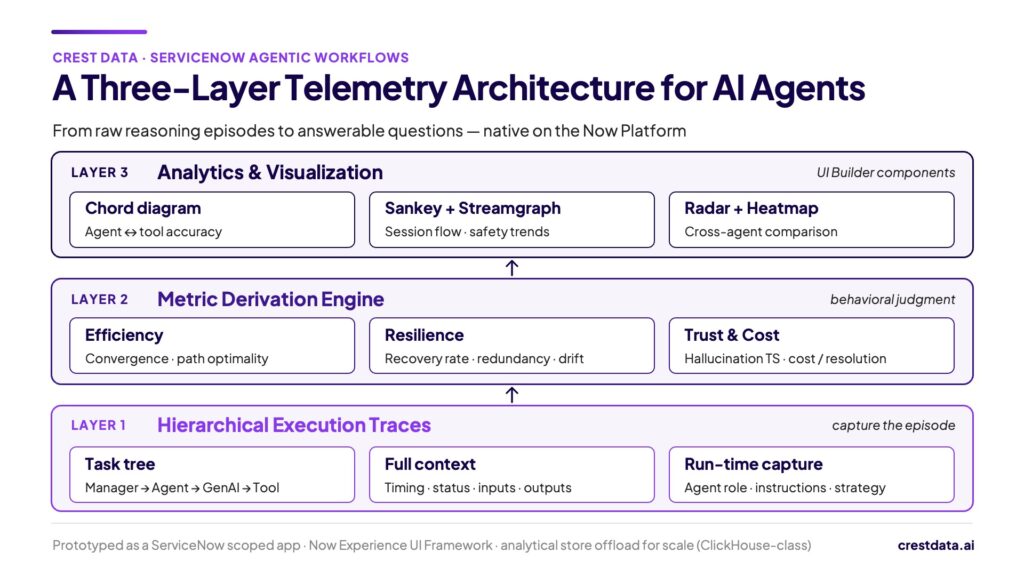
Layer 1 — Capture the reasoning episode, not just the outcome
Every agent run becomes a hierarchical execution trace: the objective, the agent team, the use case, run type, execution mode, and a recursive task tree of manager → agent → gen_ai → tool → communicator steps, each with its timing, status, inputs, and outputs.
Two design choices here turned out to matter more than we expected. The first: we capture the agent’s role, instructions, and reasoning strategy at runtime, not just its actions. So when behavior shifts, you can diff what the agent did against what it was told to be. Instruction changes become events you can correlate against, and honestly, that’s the only way we’ve found to do credible root-cause analysis on a system whose “code” is partly natural language. The second: production runs and test runs share one trace schema. That decision quietly unlocks eval-gated changes later, because the same analysis that watches production can score a candidate agent against its test suite before anyone promotes it.
If you only log results, you can count failures. If you log the reasoning tree, you can explain them.
Layer 2 — Metrics that carry judgment
Raw traces become answers through derived behavioral metrics: convergence rate (did the reasoning actually reach an outcome, or just orbit it?), path optimality (how close was the run to a clean path?), redundant call rate (the earliest smell of instruction or context rot), recovery rate (an 8% error rate reads very differently at 75% self-recovery), tool selection accuracy, drift detection against baseline, safety scores tracked per agent per week, and cost per resolution token spend attributed to business outcomes, which turns out to be the single number that reframes ServiceNow support services economics once agents enter the picture Your CFO will ask for that last one eventually.
The cost row deserves a spotlight. Agent economics are hard to see right now. A reasoning loop that retries retrieval three times doesn’t just add latency; it triples token spend, and nobody notices. The redundancy problem and the cost problem turn out to be the same problem wearing different badges. Capture the traces once, and you answer both.
Layer 3 — Views that match the questions
Agent behavior is relational and temporal, and honestly, ordinary bar charts can’t hold it. So each question gets a view built for it. A chord diagram for agent-to-tool accuracy, which shows you not just which tools fail but which agents they fail for (usually the more useful question). Force-directed graphs for reasoning coherence. Sankey flows for session paths. Streamgraphs for safety trends. Radar and heatmaps for comparing agents side by side.
One product lesson we’d pass on to anyone building this: leadership dashboards and engineering dashboards are different products. The radar chart that gives a platform owner a one-glance health check is useless to the engineer digging into why one tool keeps failing under one agent. Serve both audiences from the same trace data, and don’t make either of them squint at the other’s view.
The chart that should worry you
Point-in-time quality scores create false comfort. Trends are what create accountability.
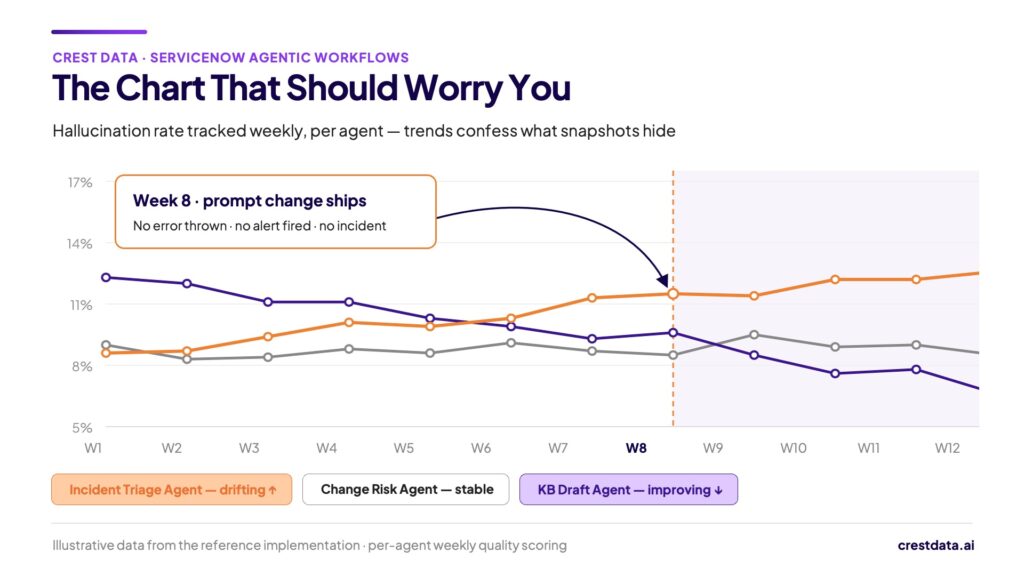
Week 8, an instruction change ships. No errors. No alert. No incident. Just a hallucination rate quietly climbing from 8% toward 15%, invisible to everything except week-over-week, per-agent quality tracking. If you take one image from this post into your next architecture review, make it this one.
There’s a deeper operational shift hiding in that chart too. Your baseline becomes a living asset. Every agent needs a behavioral fingerprint: normal step counts, normal tool mix, normal quality band maintained continuously, so that deviation shows up as a signal rather than a surprise.
The agent that “looked fine”
Here’s how this plays out, with a pattern straight from our trace data on a fairly typical ServiceNow ITSM implementation services engagement. An incident-resolution agent team runs a classic ReAct loop: fetch the incident, find similar ones, pull knowledge articles, draft a resolution plan, then iterate with the user until they approve it.
By every standard platform view, things looked fine. Runs completed. Users got their plans. No errors piling up.
The traces told a different story. Execution times for the same use case swung from about four minutes to several times that, and the swings had nothing to do with incident complexity. When we walked the task trees, the culprit was sitting right there: whenever the similar-incident search came back weak, the reasoning engine looped. Re-retrieve, re-plan, burn tokens, repeat. The chord diagram made it hard to argue with. “Get Similar Incidents” was pulling far less weight for this agent than “Get Incident Details.” Redundant calls in the affected runs sat at several times the baseline, and every extra lap cost real money.
The fix, once we could see it, was precise and a little boring, the way good fixes usually are. Tighten the retrieval tool’s output transformation. Clean up the ambiguous weak-results branch in the agent’s instructions. Add a loop guard.
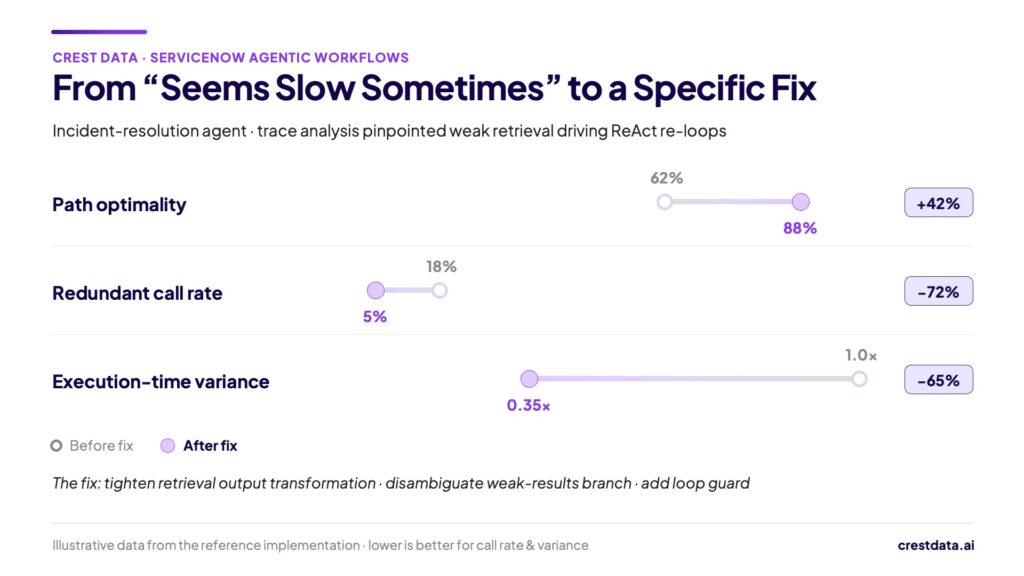
That’s the whole value in one line: execution traces turn “the agent seems slow sometimes” into a specific tool, a specific branch, and a specific fix, with the cost savings as a receipt.
Four levels of knowing your agents
Most teams can’t answer the performance question because, structurally, they’re not set up to. When we look at organizations running agentic workflows, we see four levels of visibility:
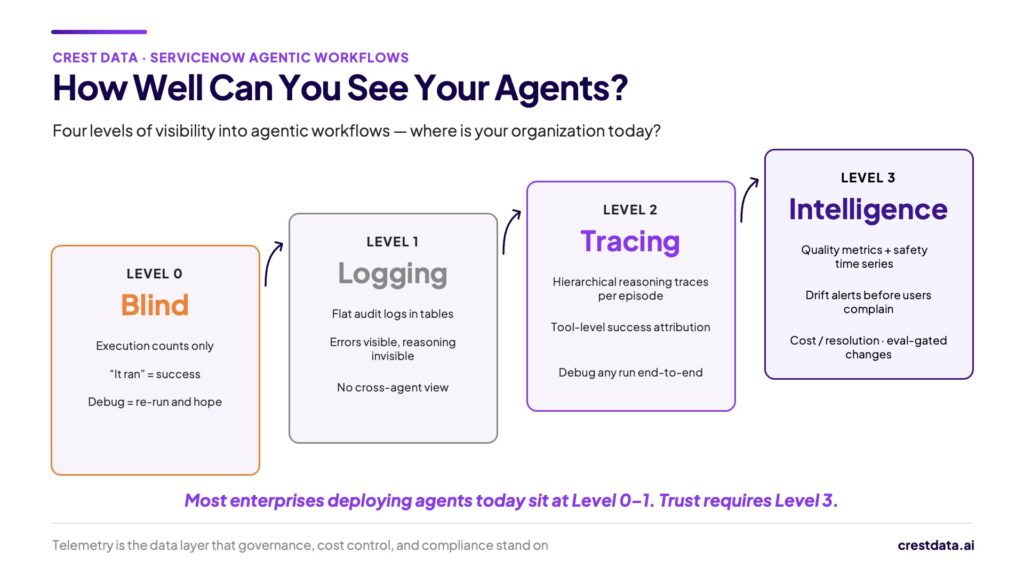
- Level 0 — Blind. Execution counts. “It ran” is the only success signal. Debugging means re-running and hoping.
- Level 1 — Logging. Flat audit records in platform tables. Errors are visible; reasoning isn’t.
- Level 2 — Tracing. Hierarchical reasoning traces per episode, tool-level attribution, and the ability to debug any run end-to-end.
- Level 3 — Intelligence. Derived quality metrics, per-agent safety time series, drift alerts that fire before users complain, cost per resolution, and eval-gated changes: no instruction or model update reaches production without scoring against the agent’s test suite first.
From what we’ve seen, most organizations running agents in production today sit at Level 0 or 1. Enterprise trust and the kind of ServiceNow managed services operation that can credibly stand behind agent behavior in production require Level 3. And not just for the dashboards. This execution data is the layer everything else stands on. Governance and control frameworks can only govern what the data makes visible. You can’t set policy on behavior you can’t see, and you can’t audit reasoning you never captured.
Three positions we’ll defend
- Capture at the reasoning level. Analyze at the platform level. Recording every reasoning step and tool call sounds expensive, until the day you have to debug an agent without it. Our answer is to put the cost discipline in the analytics tier instead: offload the high-volume execution data to a columnar analytical store built for the job (ClickHouse-class, the same move the analytics world made when event data outgrew relational databases), the kind of pattern that increasingly shows up in modern ServiceNow integration services work, and keep the platform tables lean.
- Quality is a time series. Full stop. Snapshots flatter; trends confess. Every hallucination, safety, and alignment score gets stored per agent, per window, because the number that matters is never the score itself. It’s the direction.
- Comparison is the killer feature. A hallucination score of 0.14 means nothing on its own. Put the same score next to eight peer agents, across twelve weeks, before and after an instruction change, and now you have something you can make decisions with. So design every metric to be comparable across agents, teams, and time from day one. A side effect we didn’t fully anticipate: cross-agent comparison becomes your best prompt-engineering feedback loop. When one team’s agent recovers from errors at twice the rate of its peers, its instruction patterns are worth stealing.
If you remember five things
- Agents fail plausibly, not loudly. Without behavioral data, healthy and hallucinating agents look the same.
- Trace the episode, not the transaction. Hierarchical task trees are the minimum viable data model for agentic workflows.
- Quality has to become data. Score groundedness, hallucination, and safety per run, and store them like any other metric.
- Trends confess what snapshots hide. Track quality per agent, per week, always. Your baseline is a living asset.
- Execution data is what governance stands on. You can’t govern, audit, or cost-control behavior you can’t see.
The bottom line and the series in one breath
Agentic AI on ServiceNow earns enterprise trust in one order: measurable first, then governable, then secure. Measurement has to come first because everything downstream, from governance policy to cost control to compliance evidence, is only as good as the execution data underneath it.
Two decades of hard lessons from distributed systems compress into a single warning here. The teams that scaled them safely were the ones that could see inside them first. The same will be true of agentic workflows. Except this time, the systems being watched are capable of convincing you they’re fine when they aren’t.
And that closes the arc this series set out to draw. Build agents well — instructions as the program, confidence gates, teams instead of geniuses (Part 1). Gate them before they ship — instructions reviewed like code, reach computed, policy as a check (Part 2). And then see what they’re really doing, every run, every week (this post). In our experience, that’s the order in which enterprise trust gets earned — and the organizations that follow it will be the ones whose agents still have jobs in three years.
Bring this to your instance
That closes the three-part series. Part 1 covered how to build agents that reason well. Part 2 covered how to gate them before they ship. This post covered how to see what they’re actually doing once they’re live. If your team is anywhere on the path from Level 0 to Level 3 and wants a ServiceNow implementation partner that has already walked this ground in our labs, Crest Data’s engineering team is happy to show you the framework, the traces, and the dashboards that came out of it. Talk to us about what a serious ServiceNow solutions provider engagement looks like for agent observability, from the scoped app on the Now Experience UI Framework to the analytical tier underneath, and we’ll walk you through a live demo of the proof of concept.
Thought Leader: Dhaval Bhimani