

Skip links
Grafana MarketplaceCommercial Plugin

Tableau Plugin for Grafana

Monitor Tableau operations in Grafana


Built for
Tableau
Grafana Labs
9
Tableau data categories
3.28
Tableau REST API
PAT
Secure authentication
≥ 12.0
Grafana version supported
Overview

Monitor Tableau operations in Grafana

Native Tableau REST API
Personal Access Token (PAT)
Nine Tableau data categories
Single pane of glass

The Tableau plugin is a backend data source plugin that enables on-demand querying and visualization of Tableau Server and Tableau Cloud content and operational data inside Grafana panels, using the native Tableau REST API. Analytics and platform teams get visibility into their Tableau environment in the same dashboards they already use for the rest of their stack.

Tableau is a leading business intelligence and analytics platform, and keeping it healthy means tracking not just dashboards but the content, users, and background jobs behind them. The plugin connects to the Tableau REST API to retrieve site information, projects, workbooks, views, published data sources, users, groups, background jobs, and extract refresh tasks, so teams can monitor adoption, govern content, catch failing extracts, and manage capacity from a single pane of glass.

Coverage

What You Can Monitor

The plugin exposes nine Tableau REST API data categories, selectable by query type in the query editor, spanning content, users, and operations.

01 — Content

Content & Usage

Track published Workbooks with owner, project, size, and tags, Views with optional usage hit counts, and published Data Sources with certification status and connection type. Organize it all with the Projects inventory, including owners and content permissions, to understand what content exists and how it is being used.

workbooks views data.sources projects
02 — Identity

Users & Access

Monitor site Users with role, authentication setting, and last login to track adoption and license utilization, and review Groups with domain information for a clear picture of access and governance across the site.

users groups last.login user.role
03 — Operations

Operations & Health

Keep the platform healthy with Site Info (storage and user quota, usage counts and percentages), background Jobs history with computed durations, and Extract Tasks showing schedule details and consecutive failure counts, so teams catch capacity pressure and failing refreshes early.

site.info jobs extract.tasks failure.count
See It in Grafana

Set up and query Tableau, right inside Grafana

Connect your Tableau environment, build queries with the guided editor, and visualize Tableau content and operational data through Grafana dashboards.
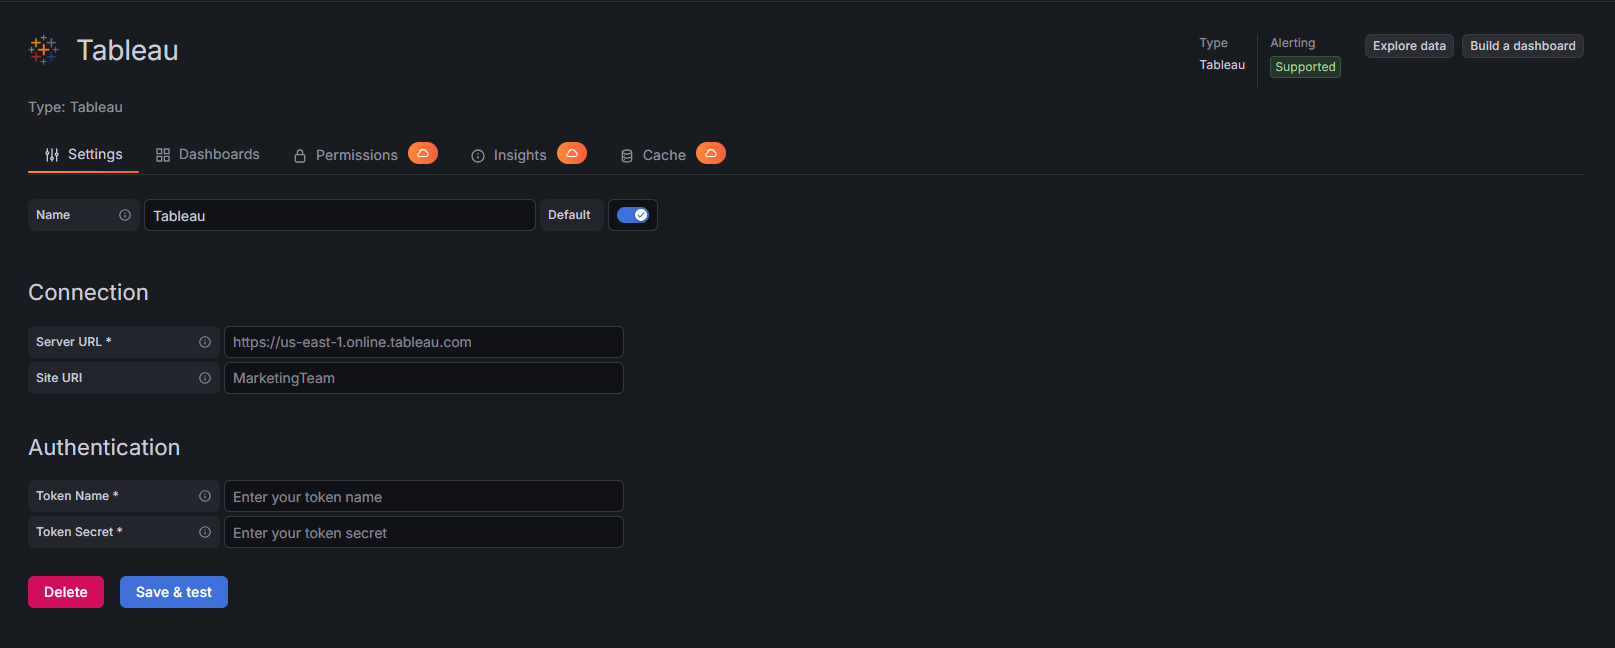
1 / 3
Tableau plugin onboarding in Grafana
01

Data Source Configuration

Connect Tableau Server or Tableau Cloud using Personal Access Token authentication and configure the data source directly in Grafana.
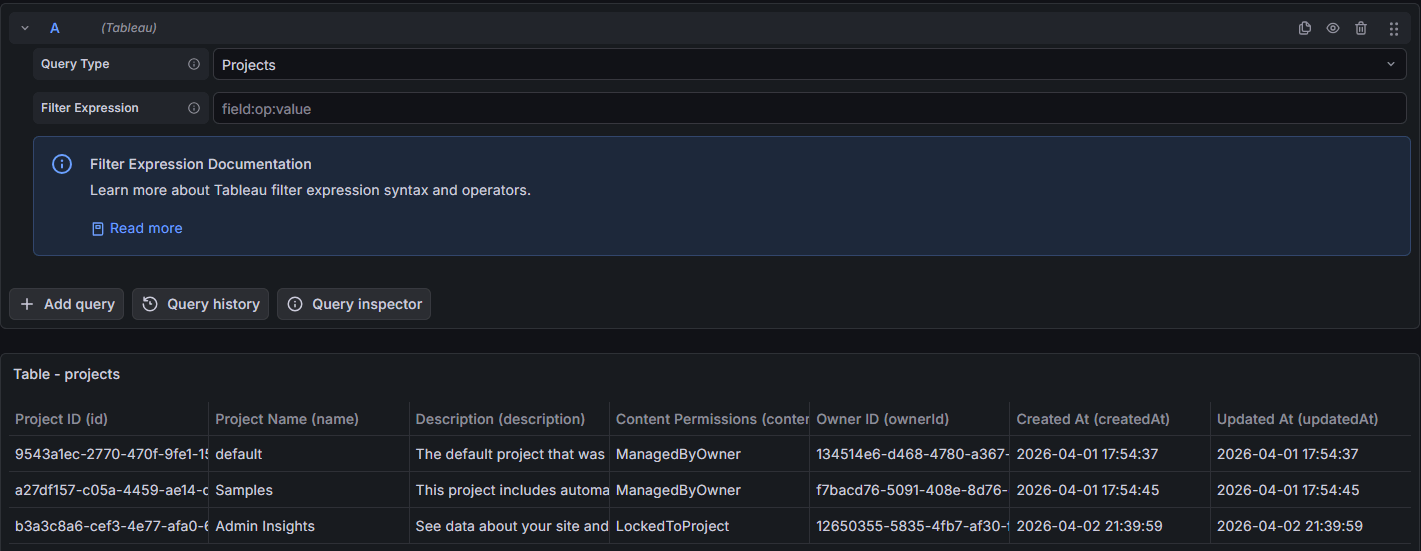
Tableau query editor in Grafana
02

Query Editor

Select Tableau data categories and apply filters to query sites, projects, workbooks, views, users, jobs, and extract tasks.
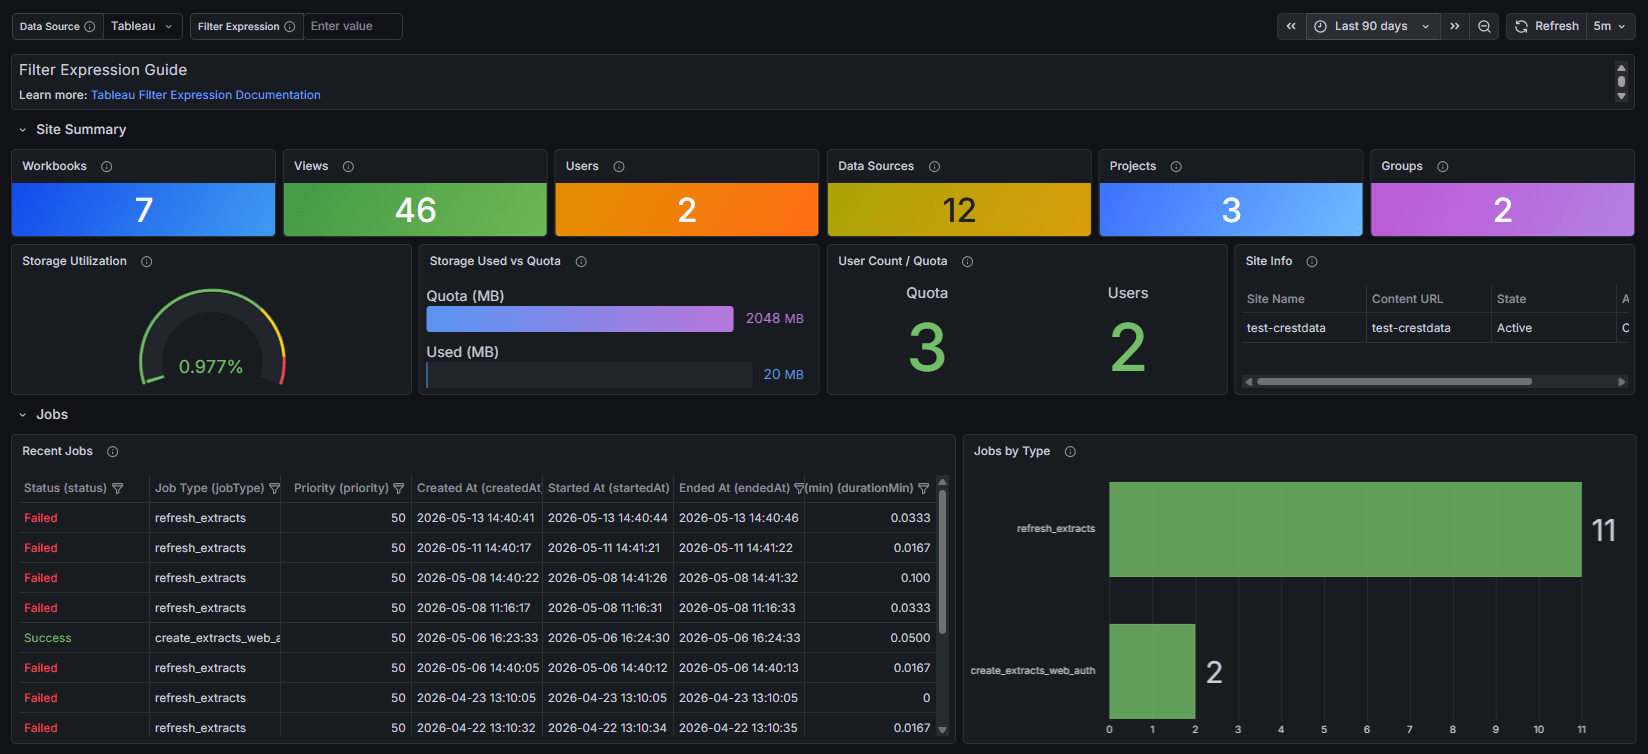
Tableau operations dashboard in Grafana
03

Tableau Operations Dashboard

Visualize Tableau content, users, jobs, and extract operations through Grafana dashboards for a unified operational view.


Differentiators

Why Crest Data's Tableau Plugin?

Native & Agentless

Talks directly to the Tableau REST API with Personal Access Token authentication from the Go backend. No agents, no exporters, no extra collection layer to deploy or maintain.

Nine Data Categories

Query Site Info, Projects, Workbooks, Views, Data Sources, Users, Groups, Jobs, and Extract Tasks for complete visibility into content, adoption, and operations across the site.

Server & Cloud Ready

Works with both Tableau Server (v2019.3 and later) and Tableau Cloud, so teams get a consistent monitoring experience regardless of where Tableau runs.

Powerful Filtering

Tableau REST API filter syntax (field:operator:value) lets analysts narrow Projects, Workbooks, Views, Data Sources, Users, and Jobs to exactly the content that matters.

Time-Range Aware

Integrates with Grafana's time picker, pushing the start bound to the API as a server-side filter and enforcing the end bound in the backend, so time-based queries stay efficient over large sites.

Resilient by Design

Automatic session management with token refresh on expiry, plus retry with exponential backoff for transient failures and transparent pagination that fetches and merges all pages.

Built and Maintained by Crest Data

Developed and proactively maintained by Crest Data as a commercial Grafana Marketplace plugin, with continuous compatibility as the Tableau API evolves.

How to Get the Plugin

Tableau is a commercial plugin on the Grafana Plugin Marketplace

To license the plugin or set up an evaluation, contact the Grafana Marketplace team.

Grafana Marketplace
plugins-marketplace@grafana.com
Plugin ID
crestdata-tableau-datasource
Get the Plugin Now