

Skip links
Grafana MarketplaceCommercial Plugin

Zscaler ZPA Plugin for Grafana

Monitor Private Access infrastructure and policies in Grafana


Built for
Zscaler
Grafana Labs
7
ZPA resource types
2
Pre-built dashboards
0
Agents or exporters required
≥ 12.3
Grafana version supported
Overview

Monitor ZPA in Grafana

Zscaler ZIdentity OneAPI
OAuth2 client credentials
Seven ZPA resource types
Single pane of glass

The Zscaler ZPA plugin is a backend data source plugin that enables querying and visualization of Zscaler Private Access (ZPA) infrastructure health and security policy data directly in Grafana panels, using the Zscaler ZIdentity OneAPI. Security and platform teams get zero-trust infrastructure and policy visibility in the same dashboards they already use for the rest of their stack.

Zscaler Private Access is a cloud-native zero trust network access solution that connects users to private applications without exposing them to the internet. The plugin connects to the ZPA API to retrieve app connectors, service edges, cloud connector groups, access policy rules, application segments, server groups, and connector groups, so teams can audit connector health, review access policies, and track configuration across their zero trust estate from a single pane of glass.

Coverage

What You Can Monitor

The plugin exposes seven ZPA resource types, selectable by query type in the query editor, spanning connectors, policies, and applications.

01 — Infrastructure

Connectors & Edges

App Connectors (operational status, control-channel health, version, location), Service Edges (Private Service Edge status and version), Cloud Connector Groups, and App Connector Groups with upgrade schedules — a live view of ZPA infrastructure health.

app_connectorsservice_edgesconnector_groupscontrol_channel_status
02 — Policy

Access Policies

Access Policy Rules across six policy types — Access, Timeout, Client Forwarding, AppProtection, Isolation, and Credential — with action, state, order, operator, and condition counts for a complete governance view.

access_policytimeout_policyclient_forwardingisolation_policy
03 — Applications

Applications & Servers

Application Segments (domain names, TCP/UDP port ranges, bypass type, health reporting) and Server Groups (membership, dynamic discovery, server and application counts) for visibility into what ZPA is protecting.

application_segmentsserver_groupsdomain_namestcp_port_ranges
Pre-Built Dashboards

Insight without building panels from scratch

Two ready-to-use dashboards — ZPA Infrastructure Health and Security Policy Audit — get teams to insight on day one, plus the configuration and query editor you'll use to make them your own.
1 / 4
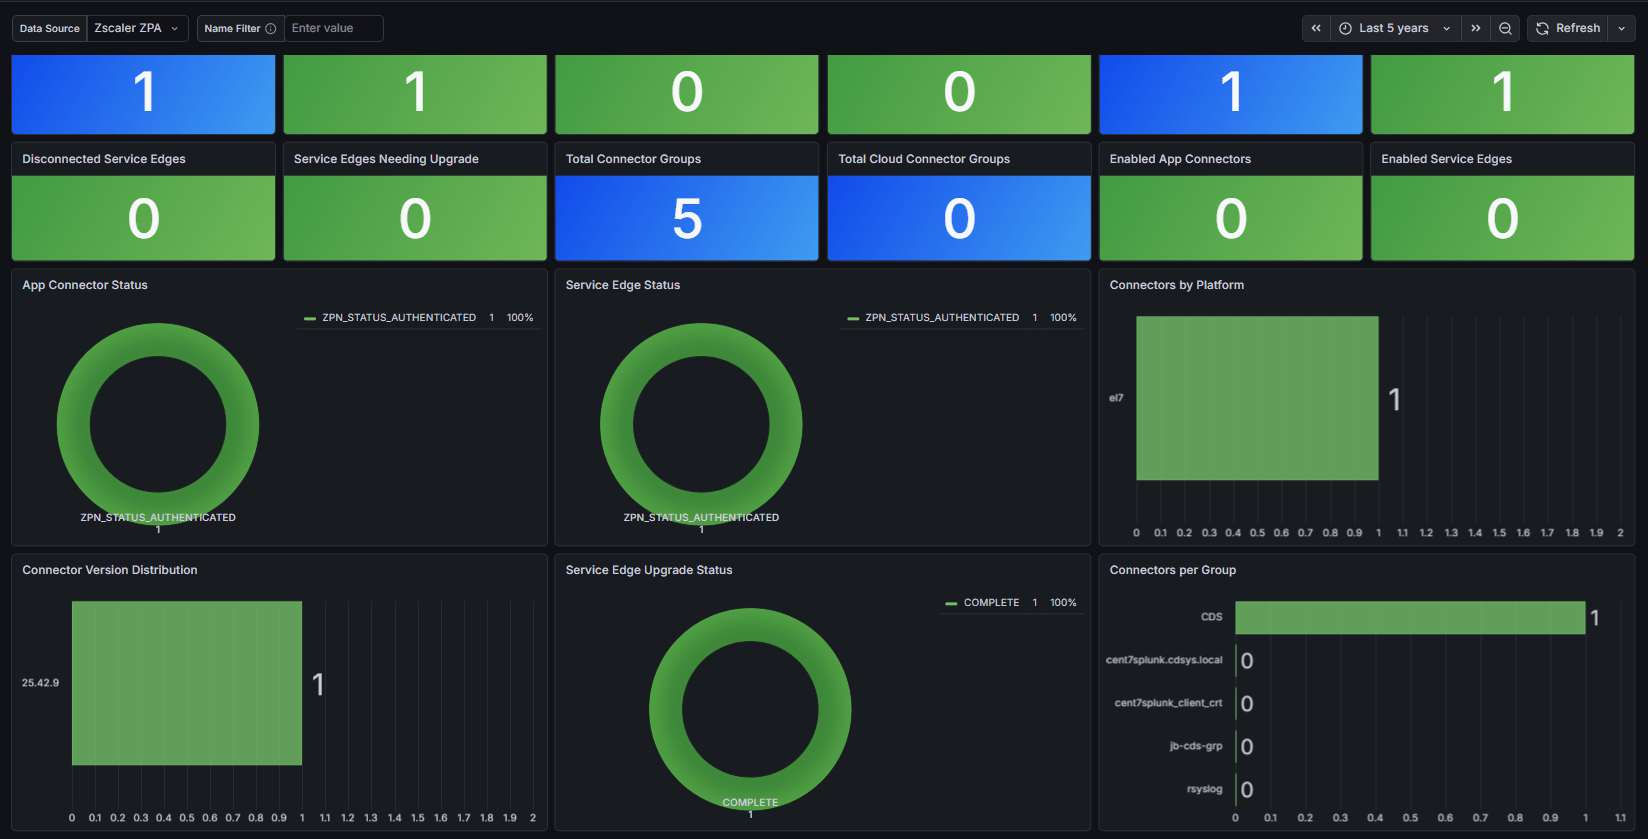
Zscaler ZPA Infrastructure Health dashboard in Grafana
01

ZPA Infrastructure Health

Total, healthy, and disconnected App Connectors, Service Edge status, connector groups, and an upgrade-status overview at a glance.
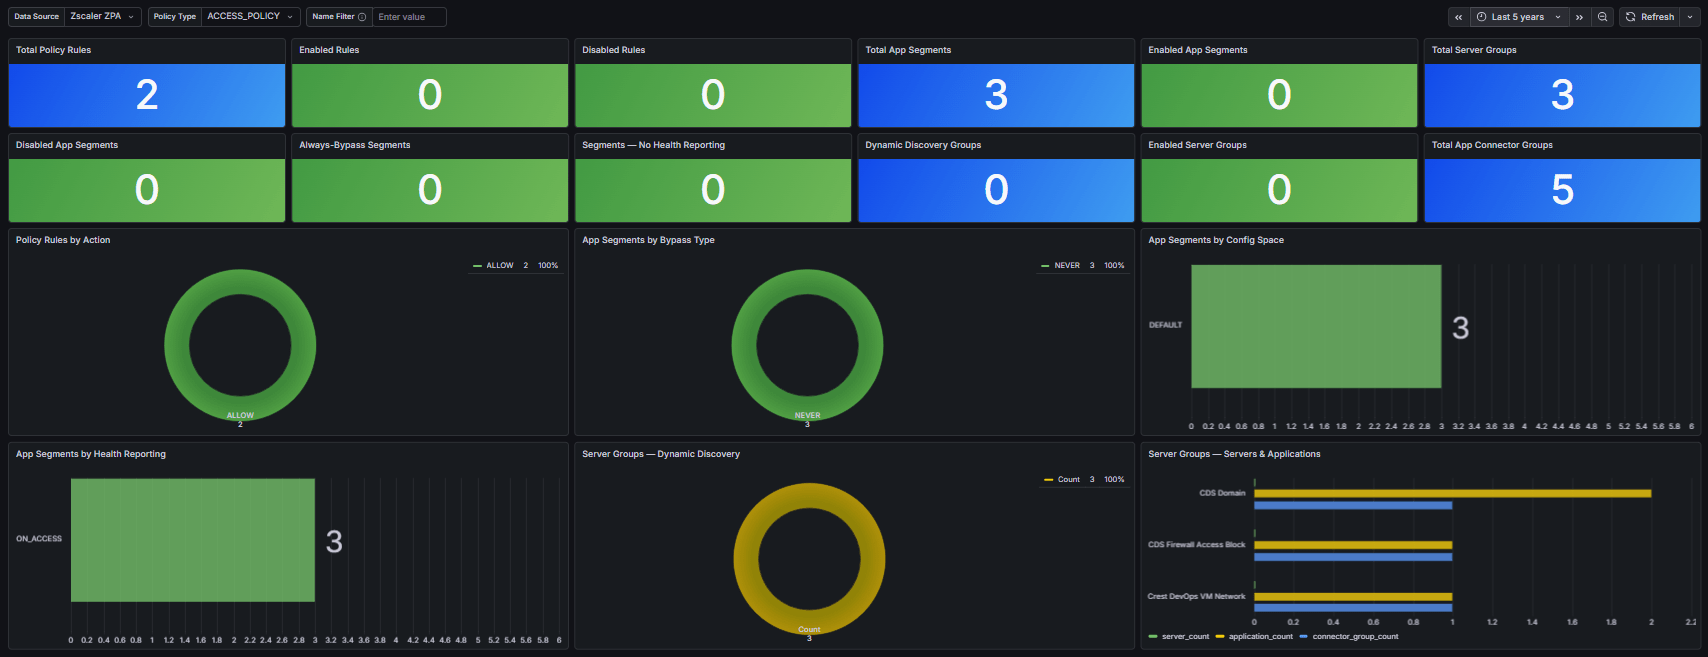
Zscaler ZPA Security Policy Audit dashboard in Grafana
02

ZPA Security Policy Audit

Access policy rules by action, application segments by bypass type, plus server group and connector group inventories for governance.
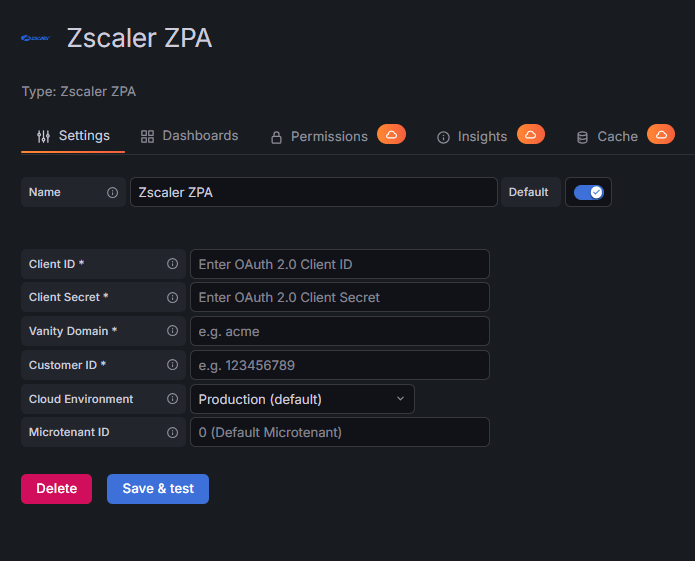
Zscaler ZPA data source configuration in Grafana
03

Data Source Configuration

Connect with OAuth2 via ZIdentity OneAPI using Client ID/Secret, Customer ID, and vanity domain, then Save & test.

Zscaler ZPA query editor in Grafana
04

Query Editor

Pick a resource type — or an access-policy type — and return a point-in-time snapshot of your ZPA tenant.


Differentiators

Why Crest Data's Zscaler ZPA Plugin?

Native & Agentless

Talks directly to the ZPA API through the Zscaler ZIdentity OneAPI with OAuth2 from the Go backend. No agents, no exporters, no extra collection layer to deploy or maintain.

Seven Resource Types

Query App Connectors, Service Edges, Cloud Connector Groups, Access Policy Rules, Application Segments, Server Groups, and Connector Groups for complete zero-trust visibility.

Full Policy Coverage

Access Policy Rules across six policy types — Access, Timeout, Client Forwarding, AppProtection, Isolation, and Credential — with action, order, and condition detail.

Official SDK & OAuth2

Built on the Zscaler ZIdentity OneAPI with OAuth2 client-credentials authentication and automatic token management, aligning with Zscaler's current, recommended integration path.

Resilient by Design

Built-in retry with exponential backoff for transient failures (up to 3 attempts), with clear, descriptive errors for authentication and connection issues.

Fast Time-to-Value

Ships with two pre-built dashboards — ZPA Infrastructure Health and ZPA Security Policy Audit. Install, point it at your tenant, and see connector health and policy governance in minutes.

Built and Maintained by Crest Data

Developed and proactively maintained by Crest Data as a commercial Grafana Marketplace plugin, with continuous compatibility as the Zscaler API and SDK evolve.

How to Get the Plugin

Zscaler ZPA is a commercial plugin on the Grafana Plugin Marketplace

To license it or set up an evaluation, contact the Grafana Marketplace team.

Grafana Marketplace
plugins-marketplace@grafana.com
Plugin ID
crestdata-zscalerzpa-datasource
Get the Plugin Now