The NetApp ONTAP plugin is a backend data source plugin that enables on-demand querying and visualization of storage metrics and operational data from NetApp ONTAP systems, using the native ONTAP REST API. Storage administrators and DevOps teams get a high-fidelity view of their ONTAP environment without leaving the dashboards they already use for the rest of their stack.
NetApp ONTAP is an enterprise-grade storage operating system that provides unified data management across SAN, NAS, and cloud environments. Storage is the backbone of the enterprise, and when it hits a bottleneck, the impact ripples through every application in the stack. The plugin brings cluster, volume, LUN, disk, and network telemetry into Grafana so teams can pinpoint congestion, track utilization trends to prevent capacity crises, and get consistent visibility whether ONTAP runs on-premises or in the cloud, all from a single pane of glass.
Coverage
What You Can Monitor
The plugin exposes six ONTAP resource types through the ONTAP REST API, selectable by resource type, metric type, and identifier in the query editor.
01 — Cluster & Disk
Cluster & Storage
A high-level view of cluster performance through throughput, IOPS, and latency metrics, plus disk-level insights including disk inventory, status, and performance, to understand the health of the underlying storage.
throughputiopslatencydisk.status
02 — Volume & LUN
Volumes & LUNs
Storage volumes with volume inventory alongside throughput, IOPS, and latency, and LUN details with the same performance metrics, for visibility into how block and file storage are serving applications.
Network interfaces with interface details and throughput, and physical Ethernet ports with port details and throughput, so teams can connect storage performance to the network paths that carry it.
Configure the data source with your ONTAP credentials, then build resource-level queries in a guided editor. The plugin also ships with six pre-built dashboards — each with a datasource variable and a default one-hour auto-refreshing range — so teams get value without building panels from scratch.
1 / 2
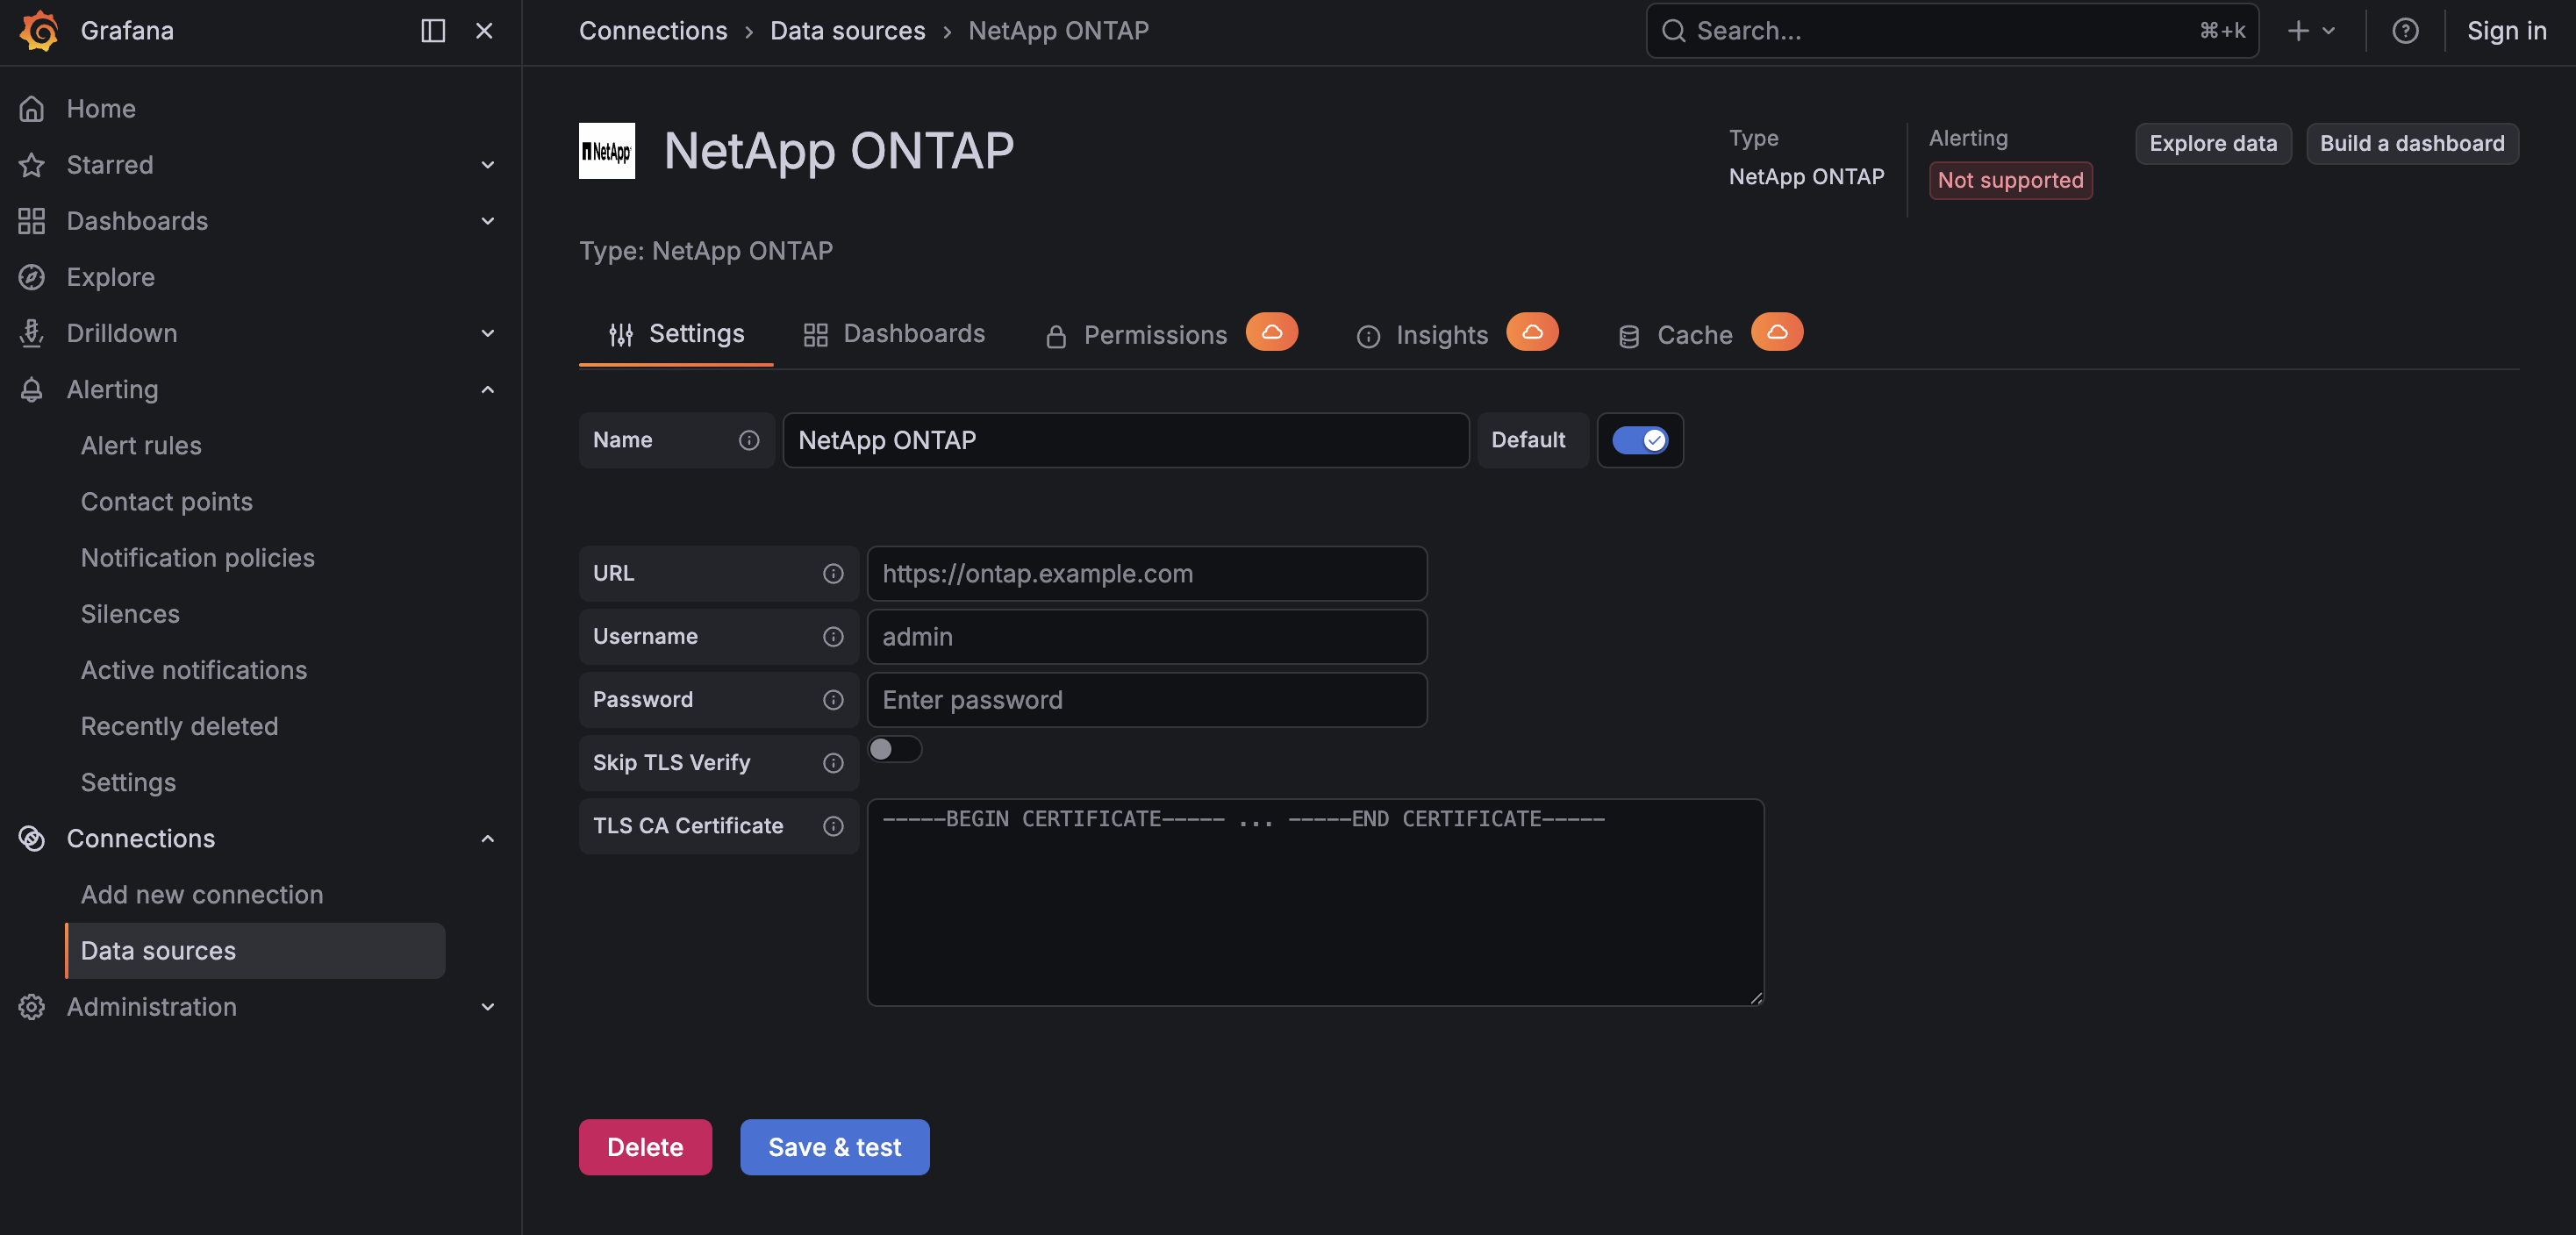
01
Data Source Configuration
ONTAP cluster URL, username and password, and an optional CA certificate, then Save & test.
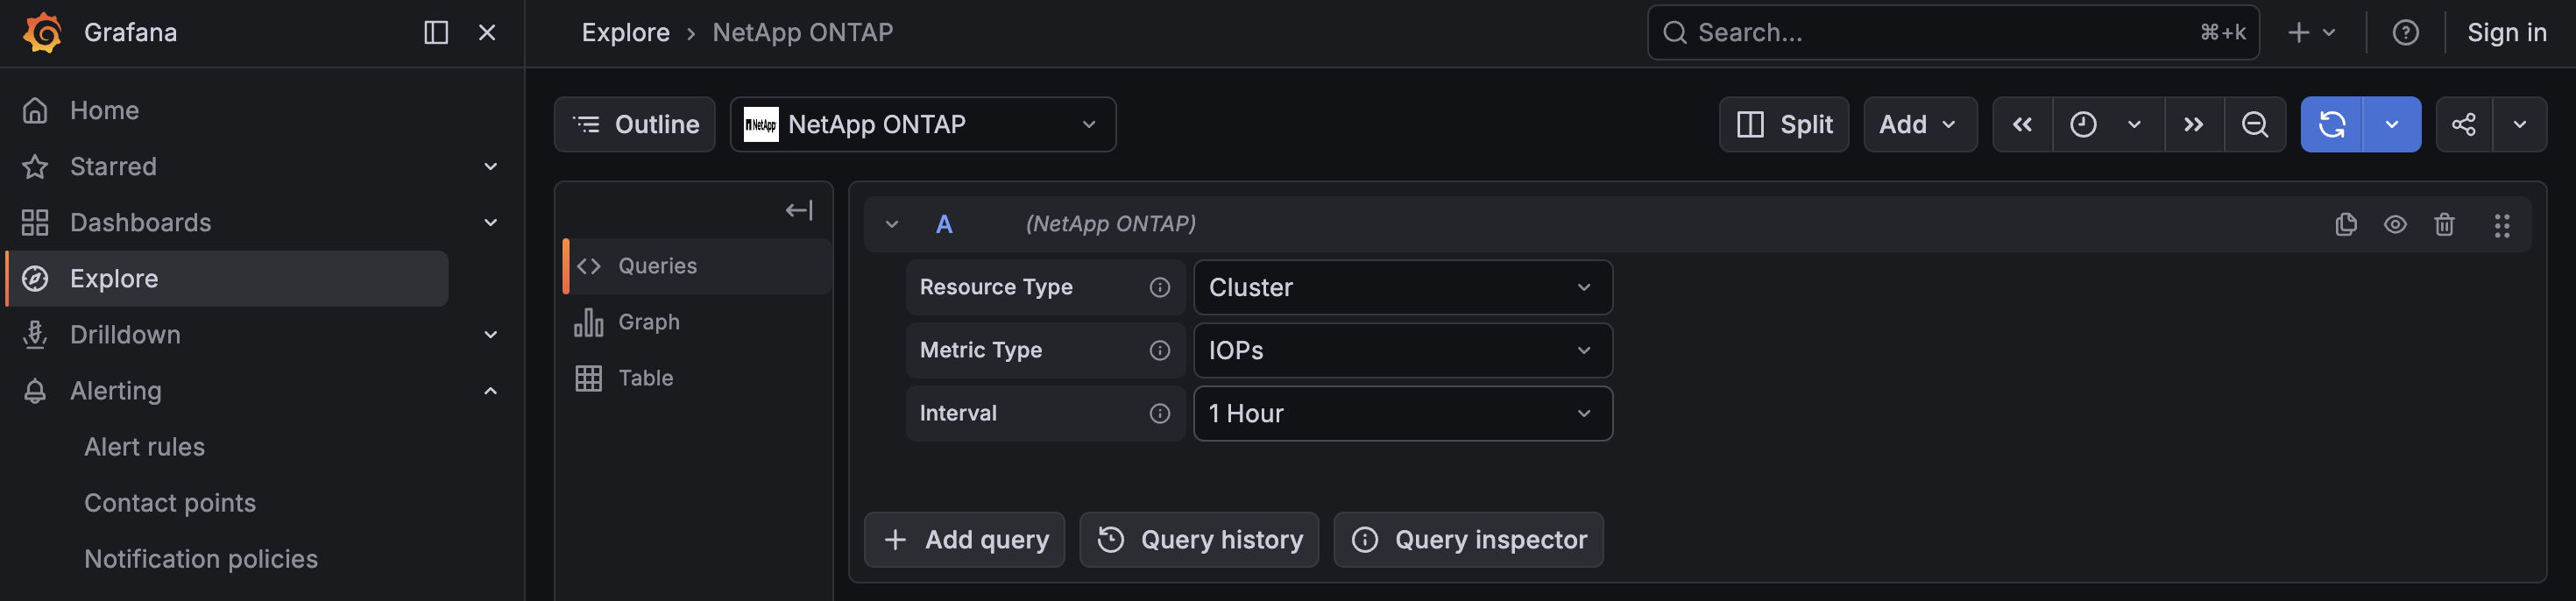
02
Query Editor
Pick a resource type, metric type, identifier, and interval to build resource-level queries.
Differentiators
Why Crest Data's NetApp ONTAP Plugin?
Native & Agentless
Talks directly to the ONTAP REST API with Basic Auth and an optional CA certificate. No agents, no exporters, no extra collection layer to deploy or maintain.
Six Resource Types
Query Cluster, Volume, LUN, Disk, Ethernet Port, and Network Interface resources for storage, capacity, and network visibility across the whole ONTAP environment.
Performance & Health Metrics
Surface throughput, IOPS, and latency for real-time monitoring and analysis of storage performance and health.
Flexible Query Editor
Pick the resource type, metric type, and identifier for targeted insights, with interval-based querying that aligns to ONTAP REST API constraints.
Resilient by Design
Built-in retry with exponential backoff for transient failures (429, 5xx, and connection errors), with optimized API interaction for efficient data retrieval.
Fast Time-to-Value
Ships with six pre-built dashboards. Install, point it at the cluster, and customers see throughput, IOPS, and latency in minutes.
Built and Maintained by Crest Data
Developed and proactively maintained by Crest Data as a commercial Grafana Marketplace plugin, with continuous compatibility as ONTAP evolves.
How to Get the Plugin
NetApp ONTAP is a commercial plugin on the Grafana Plugin Marketplace
To license it or set up an evaluation, contact the Grafana Marketplace team.
A distinguished technology leader with deep expertise in enterprise software and product engineering, he serves on Crest Data’s Board of Advisors. Sumeet is Managing Director of ServiceNow’s India Technology Centre and Senior Vice President of Engineering for the Core Business Workflows portfolio, overseeing products across HR, Finance & Supply Chain, Workplace, Health & Safety, Legal, and Contract Lifecycle Management. Previously, he held senior leadership roles at Broadcom, Cisco, and CA Technologies, scaling teams behind multi-billion-dollar product portfolios. He holds a degree in Computer Science and serves as Chair of the Telangana Regional Council at NASSCOM.
David Willis
Advisor
A strategic business, security, and technology leader with over 25 years of experience across telecommunications, financial services, and software industry verticals, he serves on Crest Data’s Board of Advisors. He currently serves as Vice President and Head of Technology Integrations, Technology Alliances at Netskope, driving strategic security and IT integrations at scale and advancing Netskope Cloud Exchange, recognized as a 2021 CRN Top 10 Cloud Security Tool. Previously, he held leadership roles at AT&T, Riverbed, and Palo Alto Networks, building strategic partner ecosystems and enterprise security programs. A former U.S. Navy Surface Warfare Officer, he actively advises and mentors several technology and consumer services companies.
Aditya Khetan
Director, WW Technical Support
Aditya Khetan is a Director of Technical Support with over 12 years of experience leading 24×7 global product support operations and customer success initiatives. He has built and scaled high‑performing teams, driving data‑informed improvements in NPS, CSAT, and operational efficiency while managing complex escalations. A Splunk Core Certified Consultant and Architect, Aditya has delivered enterprise solutions for global clients and partners closely with senior leadership to align support strategy with business goals.
Rajeev Goyal
Director, Business Development
Brings extensive sales, business development, and consulting expertise to Crest Data, where he drives strategic growth and builds high‑value enterprise relationships across ServiceNow and IT solutions. With a strong background in strategic alliances and solution‑led sales, he focuses on expanding market presence and partnership ecosystems. Rajeev has a proven track record of engaging C‑suite stakeholders, shaping go‑to‑market strategies, and accelerating revenue in competitive technology markets. His leadership blends commercial acumen with deep industry insight.
Mike Saurbaugh
Director, Security Ecosystem and Solutions, US South East
Bringing over 20 years of experience in information technology and cybersecurity. He has held senior leadership roles across strategic alliances, technical operations, and information security, including positions at VMRay, Cofense, and financial services firms. A long-time faculty member at IANS Research and owner of First Security Alliance, LLC, he has advised hundreds of clients, authored professional publications, and spoken at numerous security conferences. He holds CISSP, CISM, CRISC certifications and an MS in Information Assurance from Walsh College.
Jeet Thakkar
Director, WW Technical Sales
Jeet has over a decade of experience across Security Engineering, Implementations, and Operations. As Director of Business Development at Crest Data Systems, he leads the Tech Sales organization, driving growth, solution positioning, and strategic customer engagement. Previously, Jeet led Managed Services teams and delivered more than 100 Professional Services engagements, specializing in deploying, optimizing, and migrating enterprise security platforms such as SIEM, XDR, and UEBA. His blend of technical expertise and consultative sales leadership enables strong customer relationships and measurable business outcomes.
Damion Desai
Senior Director, US West Sales
Damion Desai leads West Coast North American sales for Crest Data, based out of San Jose. With over 25 years of experience in enterprise technology sales spanning semiconductors, optics, manufacturing and software services Damion partners closely with our engineering teams to deliver AI-driven cybersecurity solutions to some of the largest technology companies in Silicon Valley. He is a past winner of the Intel Achievement Award and holds a Computer Science degree from The University of Southern California.
Neha Mashruwala
Director, Marketing
Neha Mashruwala is a highly organized and results-oriented marketing strategist with nearly two decades of experience in driving business growth through strategic marketing initiatives.
Known for aligning marketing strategy with business objectives, Neha brings deep expertise across brand strategy, demand gen and lead gen, product marketing, thought leadership, and end-to-end digital marketing. With a strong understanding of enterprise technology, AI-led marketing, creative storytelling, and data-driven execution, she accelerates go-to-market success with a customer-first mindset.
Mili Khamar
Company Secretary and Compliance Officer
A Fellow Member of the Institute of Company Secretaries of India (ICSI), she brings over 10 years of experience in corporate governance, secretarial practice, corporate restructuring and transaction advisory, fund raising including IPOs, and capital market transactions. With strong legal acumen, she advises the Board of Directors, ensures compliance with applicable legal and regulatory frameworks, and oversees governance systems across the organization, thereby supporting Crest Data’s commitment to transparency, accountability, and responsible business conduct.
Gaytri Khandelwal
VP of Sales
Gaytri brings over 25 years of experience driving revenue growth and customer success across global enterprises. She has led large-scale GTM initiatives, including managing over $100 mn Hi-Tech portfolio as Vice President of Sales at Genpact, and held senior sales leadership roles across leading enterprise technology organizations such as Cisco and Salesforce. An IIT Delhi engineering gold medalist, Gaytri blends technical depth with strategic sales leadership to build trusted C-suite relationships and drive sustained, long-term growth.
Rishi Divate
Director, Business Development, US West
Rishi leads strategic partnerships with observability vendors, including AWS, Datadog, and Dynatrace. He brings over 20 years of experience building products, partnerships, and driving customer success across the observability, security, and application infrastructure domains. Most recently, Rishi led product management and customer success teams at PromptQL and Sumo Logic, supporting thousands of customers from Fortune 500 enterprises to emerging startups. He lives in Sacramento, CA with his family and enjoys the outdoors.
Colwin Fernandes
VP, Engineering
Bringing over 15 years of experience in cloud and DevOps engineering, he leads technology strategy and execution across product development and deployment at Crest Data. He has expertise in Kubernetes, containers, and multi-cloud architectures, building platforms for performance and scale. Prior to Crest Data, he co-founded and served as CTO of a cloud-native technology company recognized as a Great Place to Work. Colwin holds a Bachelor’s in Computer Science and multiple Kubernetes and AWS certifications.
Vance Cochrane
Director, Business Development
As the leader of Business Development and Security Ecosystem at Crest Data, Vance leverages over 25 years of experience in security technology. He previously served as a product manager at Armis, driving technical alliances and integrations, and at Nozomi Networks, where he managed protocols and hardware. Vance holds CISSP and CCSP certifications and a Bachelor’s in Physics and a Master’s in Computer Science from Rochester Institute of Technology. He holds a patent in photoprint digitizing scanner technology. Combining his deep technical expertise with strategic leadership he is deeply involved with customers and ISVs to build innovative Cybersecurity solutions.
Kushal Shah
Director, IT
With over a decade of experience in IT leadership, he oversees enterprise IT infrastructure, cloud operations, and cybersecurity at Crest Data. He leads a cross-functional IT organization, driving secure, scalable, and resilient systems while enabling key security certifications including ISO 27001, SOC 2, GDPR, and BIA. With deep expertise across AWS, Azure, GCP, and AI-driven security tools, he focuses on strengthening endpoint security, managing inhouse data centers, optimizing cloud costs, and ensuring reliable, well-governed IT operations across the organization.
Devanshi Raichura
Director, HR
An HR leader deeply committed to people and culture, Devanshi brings over a decade of experience across diverse industries. As Director, HR at Crest Data, she drives culture-first people practices and builds high-impact HR teams aligned with business outcomes across India and the US teams. Known for her sharp insight, empathy, and storytelling-driven influence, she blends strategy with human connection. Outside of work, she cherishes time with her little one, enjoys playing cricket, and loves reading to him.
Nirav Thakkar
Chief Financial Officer
With more than 25 years of leadership experience in finance, he oversees financial strategy and operations across domestic and international business units. He leads enterprise-wide financial governance, compliance, and growth planning. With deep expertise across finance, taxation, legal operations, procurement, and revenue assurance, he has helped build and scale businesses, including a technology startup in video analytics. Nirav holds an M.Com, CA, a Diploma in Foreign Exchange Risk Management, and is a D&B Certified IFRS Professional.
Neha Shah
Co-founder and Chief Techology Officer
With over 25 years of global experience across technology leadership, large-scale product engineering, and operational excellence. She defines and drives Crest Data’s engineering vision and execution across data and AI foundation for security, observability, automation, and cloud domains. Prior to Crest Data, Neha held senior engineering leadership roles at Cisco and other organizations. She has received several engineering awards including Cisco’s Pioneer award and holds a patent in networking security.
Neha holds a bachelor’s engineering degree in Computer Engineering from Gujarat University and a Master’s degree in Computer Networking from North Carolina State University.
Malhar Shah
Co-founder and Chief Executive Officer
Malhar defines the vision and drives a customer-first, agile, and empowering culture rooted in equality and continuous learning. With over 25 years of enterprise technology leadership, Malhar drives strategic growth in data and AI, security, DevOps, and cloud spaces while fostering innovation and team excellence at Crest Data. His strategic leadership positions Crest Data as an AI-first product engineering and technology solutions provider that accelerates clients’ success in a rapidly evolving technology landscape.
Prior to founding Crest, Malhar held leadership roles in product management at Cisco’s Insieme Business Unit (acquired by Cisco in 2013) and Nuova Business Unit (acquired by Cisco in 2008) where he led the growth of Cisco’s Data Center Switching business from inception to an annualized revenue of over $1.5 bn.
Malhar holds a bachelor’s engineering degree in Civil Engineering from Gujarat University and a Master’s degree in Computer Networking from North Carolina State University.