

Skip links
Grafana MarketplaceCommercial Plugin

Dell PowerScale Plugin for Grafana

Bring PowerScale storage health and OneFS performance into Grafana


Built for
Dell Technologies
Grafana Labs
11
Queryable OneFS resources
3
Pre-built dashboards
0
Agents or exporters required
≥ 12
Grafana version supported
Overview

Monitor Dell PowerScale directly inside Grafana

Native OneFS Platform API
Session auth + optional CA verification
Single pane of glass for scale-out NAS
Self-managed & Grafana Cloud

The Dell PowerScale plugin is a backend data source plugin that queries and visualizes PowerScale (formerly Isilon) cluster metrics, storage statistics, and system events inside Grafana, using the native OneFS API. Storage administrators and DevOps teams get a high-fidelity view of their scale-out NAS environment without leaving the dashboards they already use for the rest of their stack.

PowerScale delivers high-performance, scalable storage for unstructured data, and when it hits a bottleneck, the impact ripples across every application it serves. The plugin connects to the OneFS API to retrieve real-time and historical metrics, including cluster health, node performance, protocol statistics, storage capacity, quotas, NFS exports, and system events, so teams can pinpoint congestion, forecast capacity, and audit configuration from a single pane of glass.

Coverage

What You Can Monitor

The plugin exposes cluster, node, and protocol-level metrics through the OneFS Statistics API, with node-specific filtering for detailed per-node analysis.

01 — Cluster

Cluster Metrics

CPU utilization, network throughput, IFS filesystem capacity and usage, SSD statistics, and overall cluster health across all nodes.

cpu.usernet.bytes.inifs.capacitynode.health
02 — Node

Node Metrics

Per-node CPU, network, capacity, and memory, with L2/L3 cache hit and miss rates plus disk latency, queue depth, and transfer rates.

cache.l2.hitcache.l3.missdisk.latencyqueue.depth
03 — Protocol

Protocol Metrics

Operations across NFS, SMB, and protocols like SyncIQ, HDFS, and S3, with active and connected client counts to gauge real workload demand.

NFSv3SMB2/3SyncIQS3HDFS
Pre-Built Dashboards

Insight without building panels from scratch

Three ready-to-use dashboards get teams to insight on day one, plus the data source configuration you'll use to make them your own.
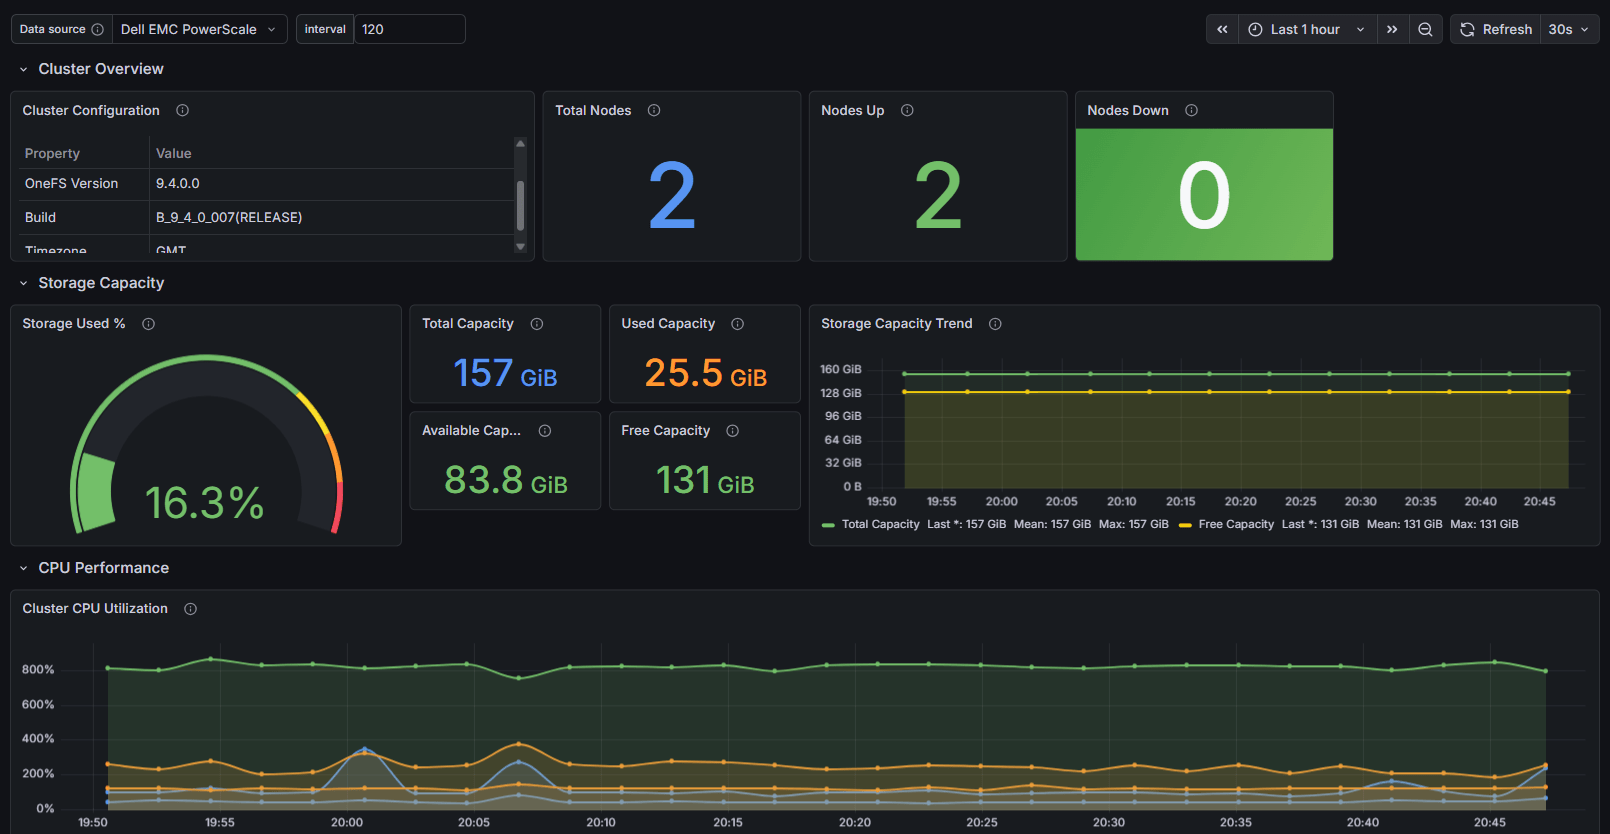
1 / 4
Dell EMC PowerScale — Cluster Health and Overview dashboard in Grafana
01

Cluster Health and Overview

A high-level view of cluster uptime, node status, and overall system health.
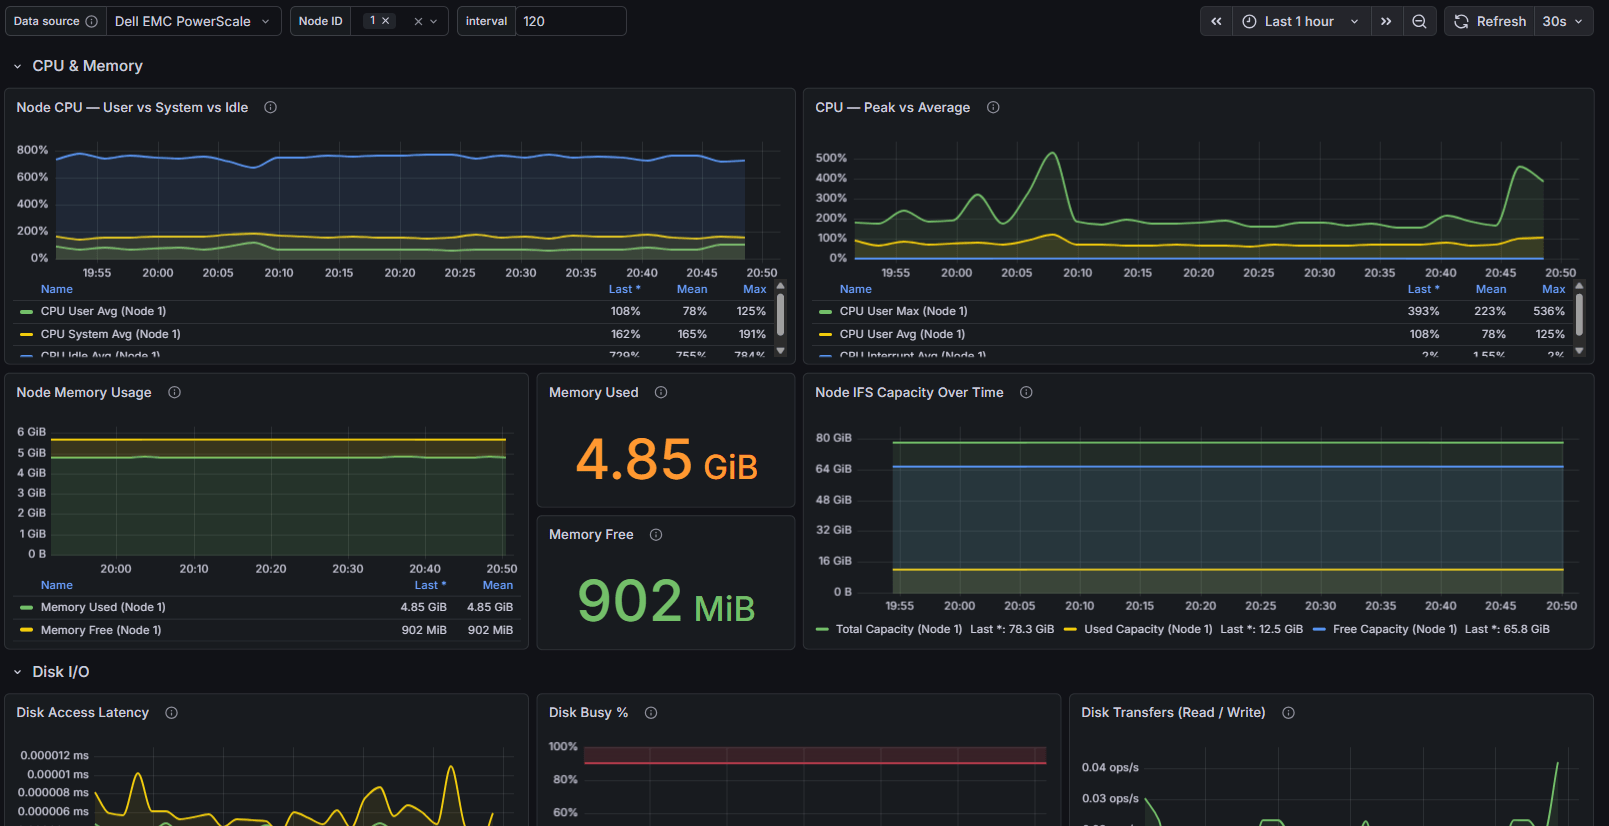
Dell EMC PowerScale — Performance and Network dashboard in Grafana
02

Performance and Network

Throughput, latency, and network activity to spot congestion and performance spikes.
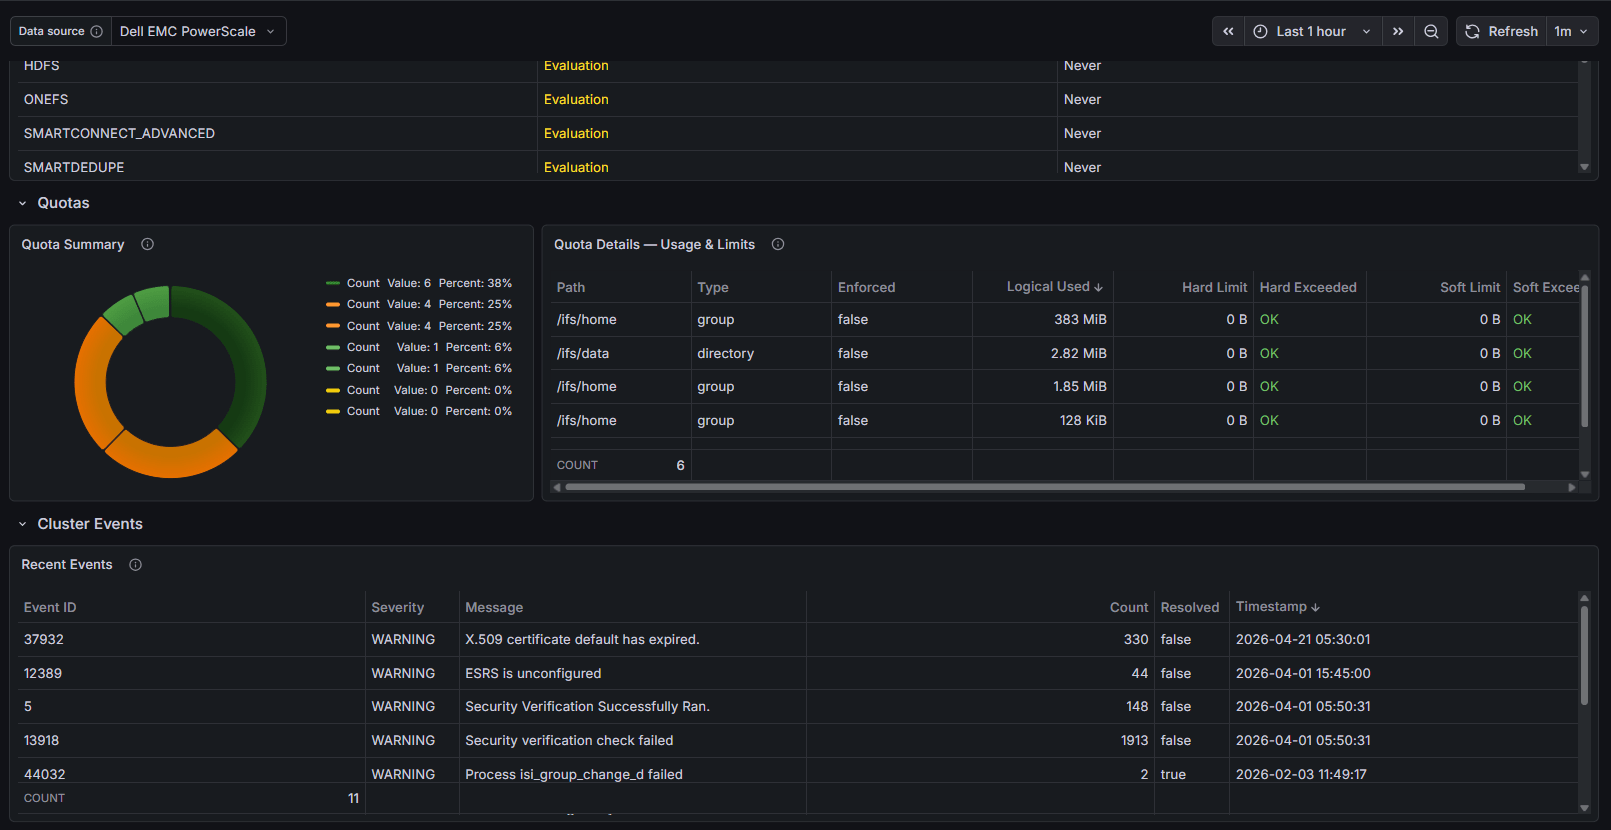
Dell EMC PowerScale — Cluster Insights dashboard in Grafana
03

Cluster Insights

Deeper capacity, storage pool, and workload analytics for planning and optimization.
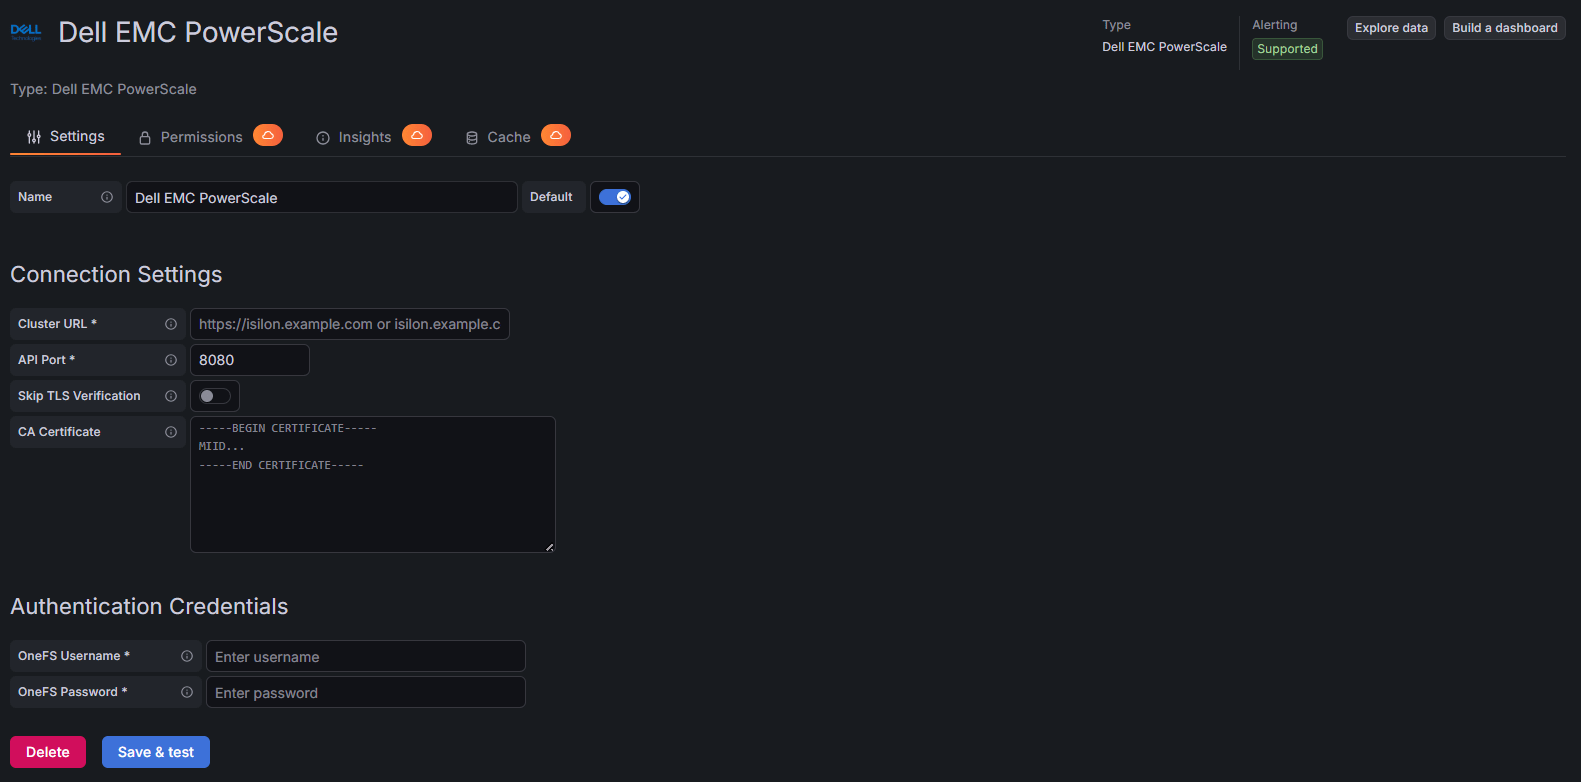
Dell EMC PowerScale data source configuration in Grafana
04

Data Source Configuration

Cluster URL, API port, TLS with optional CA certificate, and OneFS credentials, then Save & test.


Differentiators

Why Crest Data's PowerScale Plugin?

Native & Agentless

Talks directly to the OneFS Platform API in real-time with session authentication and optional CA certificate verification. No agents, no exporters, no extra collection layer.

Deep OneFS Coverage

Eleven queryable resources spanning statistics, workloads, storage pools, node pools, quotas, NFS exports, events, and licenses, well beyond basic capacity monitoring.

Fast Time-to-Value

Ships with three pre-built dashboards. Install, point it at the cluster, and see cluster health, performance, and capacity in minutes.

Resilient by Design

Built-in retry with exponential backoff for transient failures, plus automatic session re-authentication so dashboards stay live.

Flexible Query Editor

Pick the resource, metric type, metric keys, and node filters for targeted insights, with time-series support for historical trending.

Built and Maintained by Crest Data

Developed and proactively maintained by Crest Data as a commercial Grafana Marketplace plugin, with continuous compatibility as OneFS evolves.

How to Get the Plugin

Dell PowerScale is a commercial plugin on the Grafana Plugin Marketplace

To license it or set up a trial, contact the Grafana Marketplace team.

Grafana Marketplace
plugins-marketplace@grafana.com
Plugin ID
crestdata-dellemcpowerscale-datasource
Get the Plugin Now